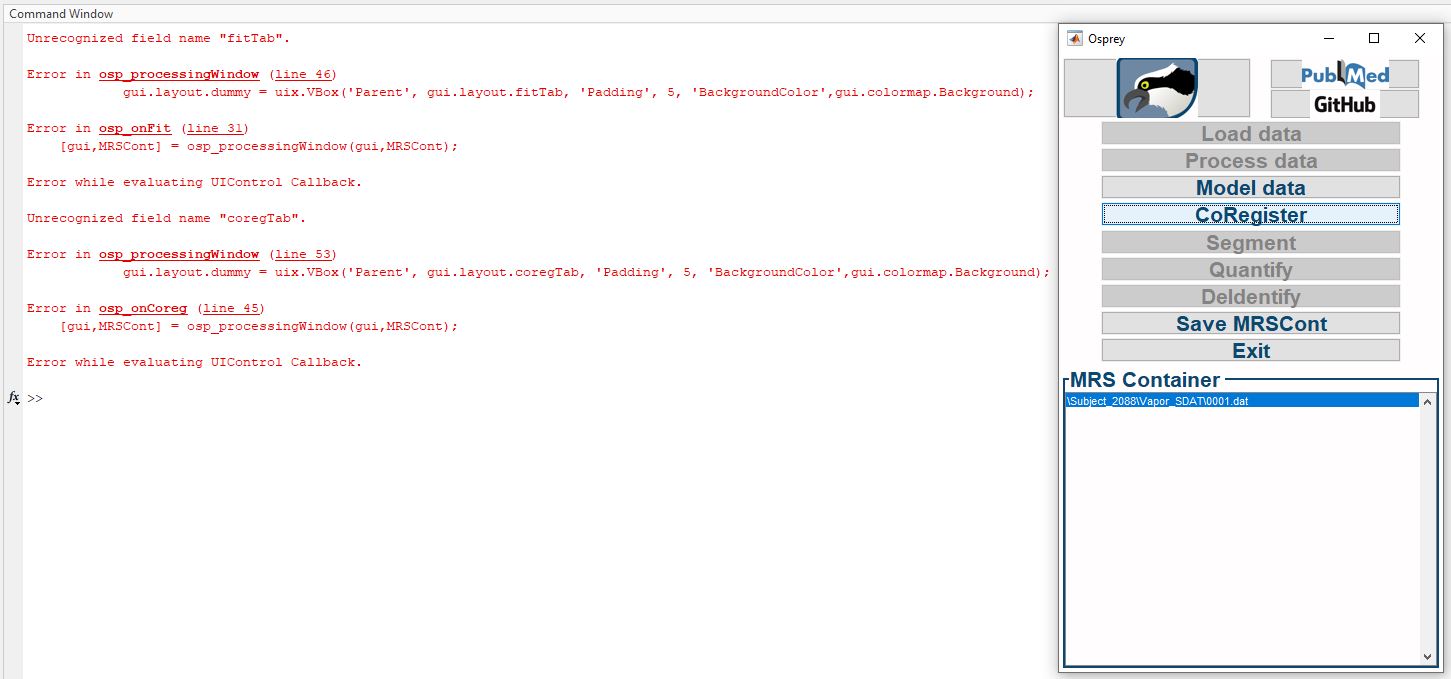
Hey all you Osprey wizards! I’m just starting my journey in the world of Spectroscopy, and have been working through getting some data processed in Osprey - i installed both the GUI and Widgets toolboxes prior to starting, and am running with just SPM added to path without subfolders, however when i get to the step of loading the Model data and coregister parts of the toolbox in Osprey GUI i run into an error saying the fontname is not recognized. Would anyone have any idea what might be causing this / a way to work around it? I’m sure i’m doing something silly ![]()
Thanks in advance!
Lewis Crawford
Hi @LewisSpectra,
Thanks for reaching out and great to hear that you are embarking on an exciting journey into MRS!
This is very hard to debug from my side because the point at which the function is crashing seems to be random. The gui.font parameter is used several times before this specific line and is somehow not resulting in a crash. I’ve two ideas on how to figure this out from here:
- Try to run the GUI with the jobSDAT.m jobfile in the exampledata folder to see if it results in the same crash.
-
[MRSCont] = RunOspreyJob('jobSDAT.m');
OspreyGUI(MRSCont);
With the path to the jobSDAT.m example job file.
Best,
Helge
Hi Helge! Just happy to be here in the Spectra community!
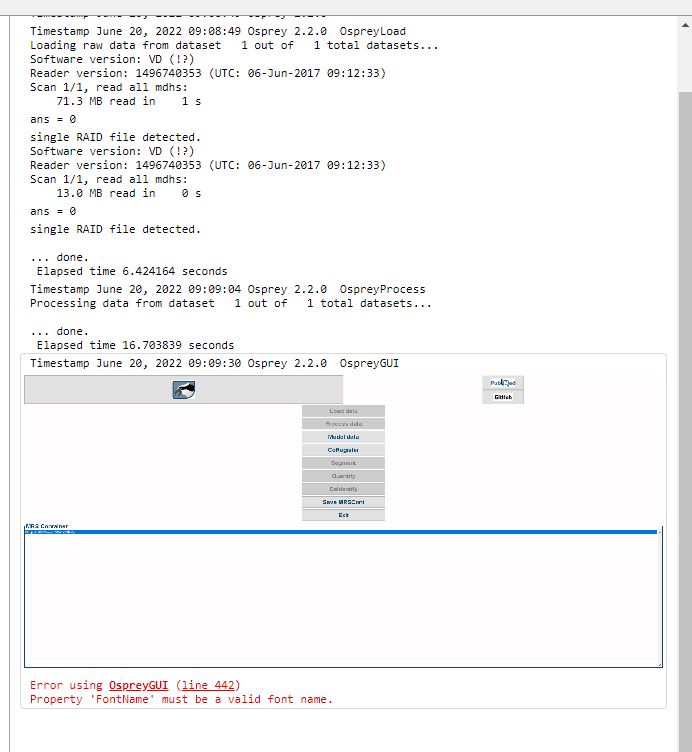
Thank you for the potential workarounds - from what i can see, attempting (1.) results in the same error at line 442 regarding font name, and the same errors at like 46 and 53 when trying to coregister and model data on the exampledata sdat mega file.
Attempting (2.) however works a treat! It runs through seamlessly and fits the data etc., producing me outputs for the fit, segmentation, etc. - this provides a bit less transparency i guess in terms of the GUI but seems like a good solution for now ![]() i will try this on some of my datasets and see where i get to, as long as i set my version of the job file up correctly this should work nicely
i will try this on some of my datasets and see where i get to, as long as i set my version of the job file up correctly this should work nicely
Thanks again for your help! Really lovely community here have already spoken to Georg on occasion and really appreciate the work you guys put in ![]()
All the best,
Lewis
Hi @LewisSpectra,
I have just pushed a fix onto the develop branch. It could potentially be related to the pause on error function in MATLAB. Did you have this turned on? Because I saw a yellow in Matlab as well which was an automatic catch from MATLAB converting an error into a warning. However, this could be stopped by the pause on error function.
Let me know if this solves your issue.
Helge
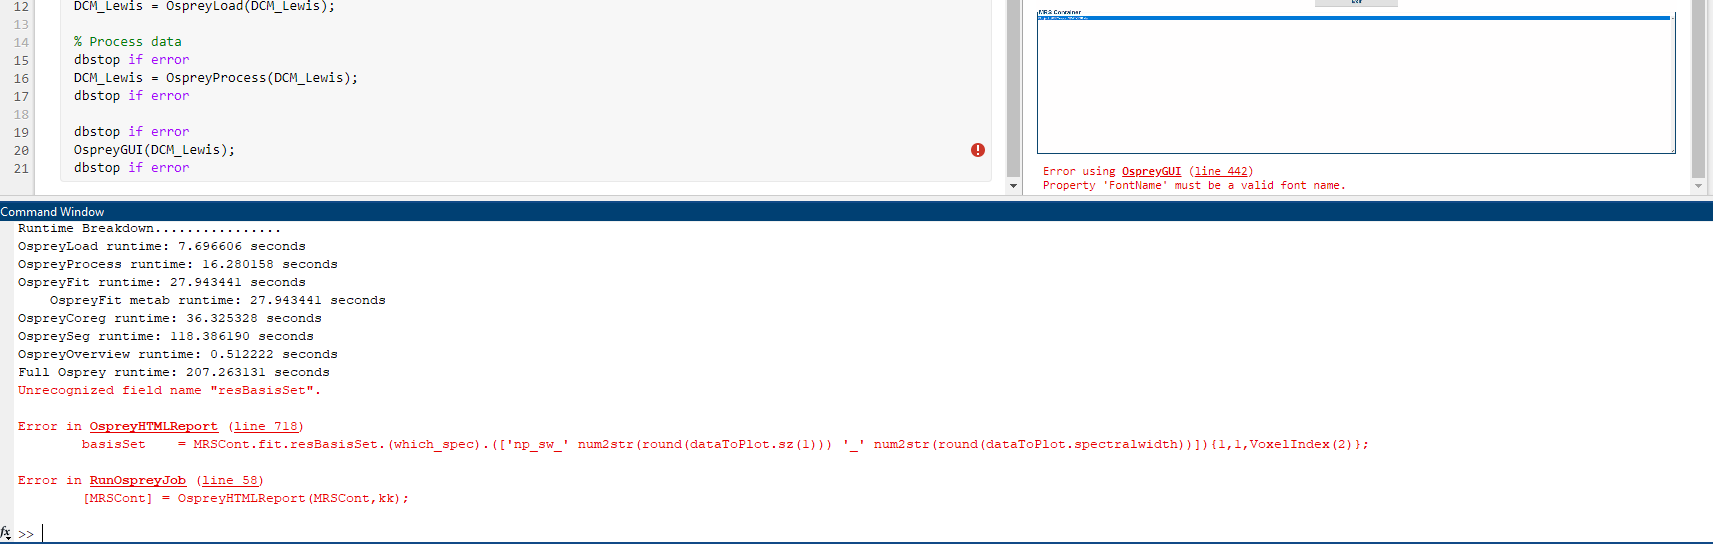
Hey Helge! Thanks for doing that, i’ve installed the new branch but seem to still be running into the same error when trying to run the data through a .mlx - image below.
However, the solution (2.) still seems the get the job done, i’m just now running into a different error reegarding the “resBasisSet” function - however this only seems to be an issue with the production of the report, and i’m still getting output files generated in the derivatives folder: “Quantify results”, “segmaps”, and “reports” among others. I guess my question would be, are the results in this folder produced after segmentation is taken into account? (ie. scaled by GM, WM, CSF in our cube) - if yes, perhaps these errors are not too damaging as i can still plot values etc. consistently with your workaround. Let me know what you think, ideally it would be nice to be able to use the GUI but not the end of the world ![]()
ps. i couldn’t figure out a way to do the “pause on error” function (im a bit of a coding naive), but i just put “dbstop if error” throughout my .mlx script as i looked up this did a similar thing, and still ran into the issue - is there another way to do this?
All the best and appreciate all your help so far ![]()
Lewis
Hi @LewisSpectra,
The analysis should be finished and you should be able to access all the results at least from what I can see in your image. In the QunatifyResults folder you have a *_TissCorrWaterScaled_Voxel_1_Basis_1.tsv file for each subspectrum with the scaled results. And you should also be able to look at the results in the GUI by loading the .mat file in the derivatives folder into MATLAB and calling the GUI afterward:
OspreyGUI(MRSCont)
However, I’m puzzled about why the HTML report is crashing.
Would you be able to share your data, jobfile, and the .mlx file with me? Also are you on MacOS or Windows?
Best,
Helge