I’ve obtained a few spectra with different B0 shimming algorithms in the Frontal region at a 3 T Siemens scanner (unedited PRESS sequence with TE:135). I’ve used a simulated basis set from MRScloud, removed the water peak, and used a default baseline modeling in FSL-MRS (second-order polynomial). My question is if the modeled baseline is optimal in these spectra. Regarding the fitting results what CRLB threshold is considered optimum for a given peak?
I think Will might be on paternity leave at the moment, so let me chime in here for a bit:
The use of hard cut-offs of relative CRLBs is discouraged since it biases against low concentrations (see here), but as a rule of thumb, lower CRLB is better.
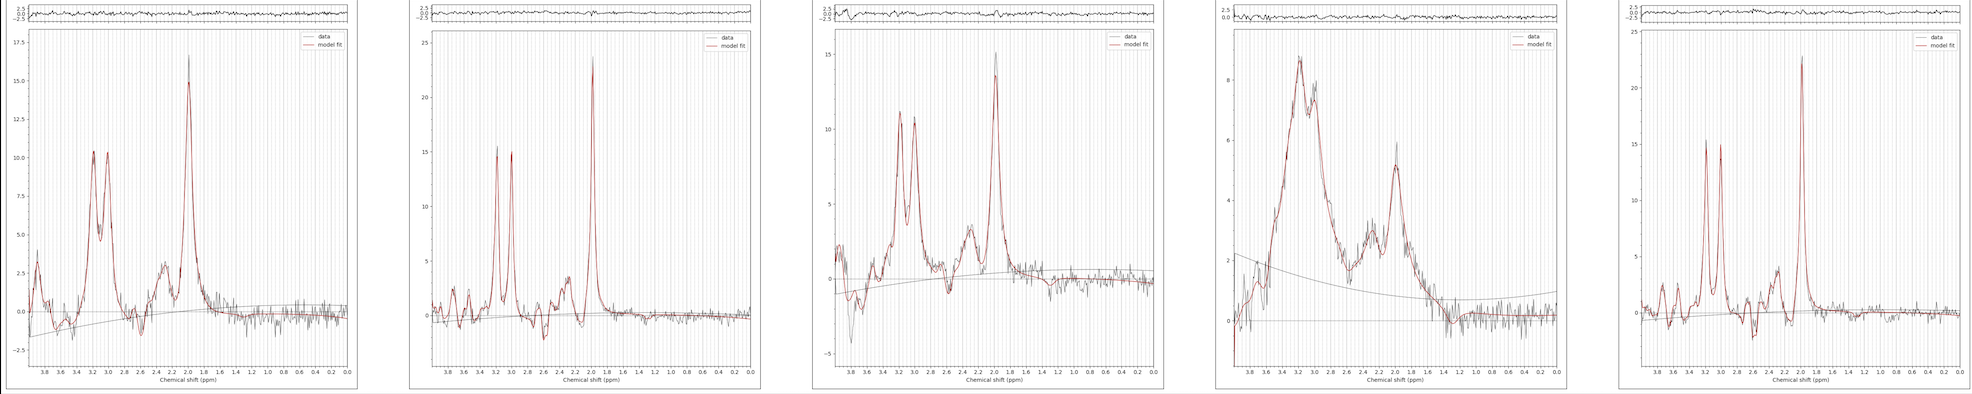
Looking at these plots, number 2 and 5 are clearly the best in terms of linewidth (and, I would assume, that will translate into lower CLRB). 1 and 3 are much worse, and 4 is basically unusable. You want to look for at the very least clearly separated tCr and tCho signals, and some structure in the Glu/Gln/GSH/GABA/Asp regions (not just one big hump).
I wouldn’t worry too much about the baseline in this scenario. There is very little MM/Lip left at TE = 135 ms, and as you can see, the baselines are all well-behaved except in 4, which should be discarded due to poor shim anyway.
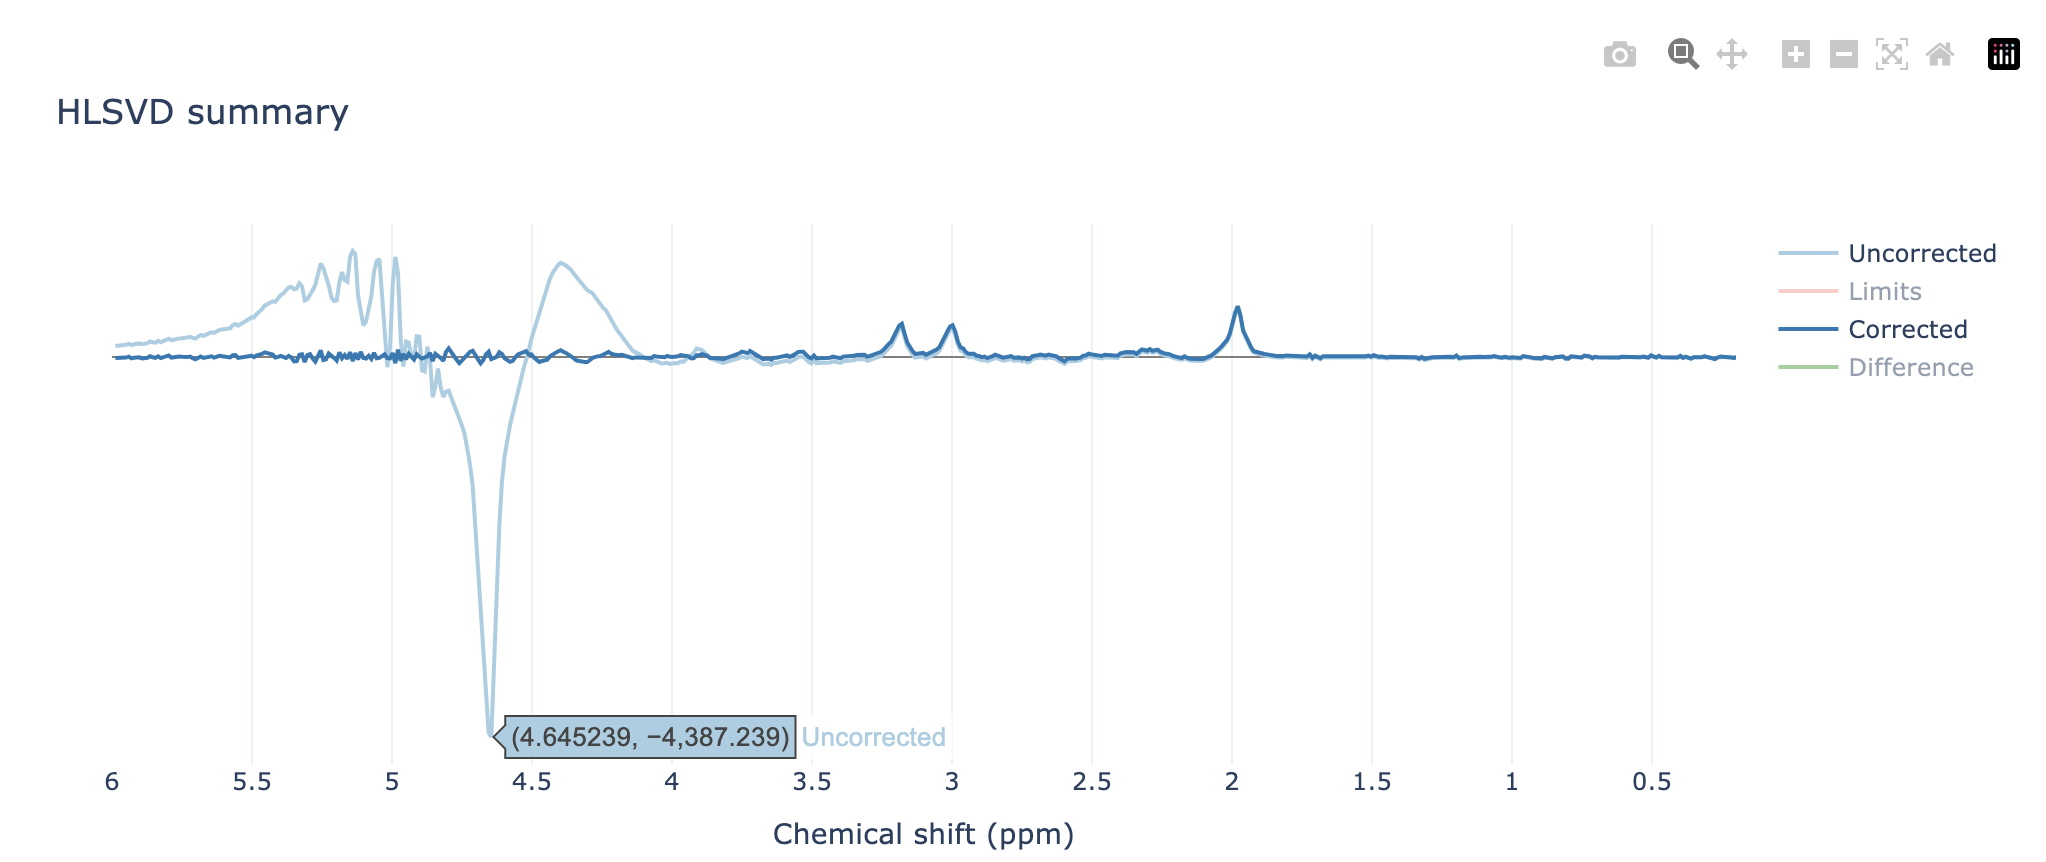
@admin Thank you for your response. I have another question which is about the water suppression. Is it normal to see a huge water peak as you can see in the following image in a water supposed spectra? For these, I did manual shimming and adjusted the f0, but I doubt if something was wrong with the water suppression.
Hi @admin,
Could you provide feedback on my question about water suppression? This data was acquired using a 3 T Siemens scanner. For data acquisition, I performed manual shimming in the adjustment window as follows: I adjusted f0 with the default tune-up shim settings, then acquired a field map, calculated a new set of shim settings, applied them, and finally adjusted f0 based on the newly calculated shim coefficients.
I’d say it isn’t completely unlikely to see the water suppression struggle in a more challenging region like the frontal cortex, but I don’t know exactly how the Siemens water suppression optimization works internally, to be honest. This is product, right? Not the CMRR sequence?
I can’t comment specifically on your shimming procedure (it’s been a while since I’ve done that on the Siemens - my impression had been that the field-map-based methods have improved compared to the old Trio I trained on), but when you say manual shimming, do you mean you interactively adjusted the shim currents?
@admin Thank you so much for your comment. Yes, this is a product sequence. By manual, I meant just adjusting it in the adjustment tab rather than letting the scanner do it automatically. No, it was not interactively adjusted. Another thing that comes to my mind is the saturation bands that I put close to the voxel. Could the saturation bands induce eddy currents and affect water suppression?
I don’t think the sat bands are too much of an issue (just make sure you don’t put them too close to the voxel to avoid deleting signal from inside - I believe Ivan Tkac has one suggested at least 7 mm space but I can’t recall for what field strength or pulse bandwidth that was valid).
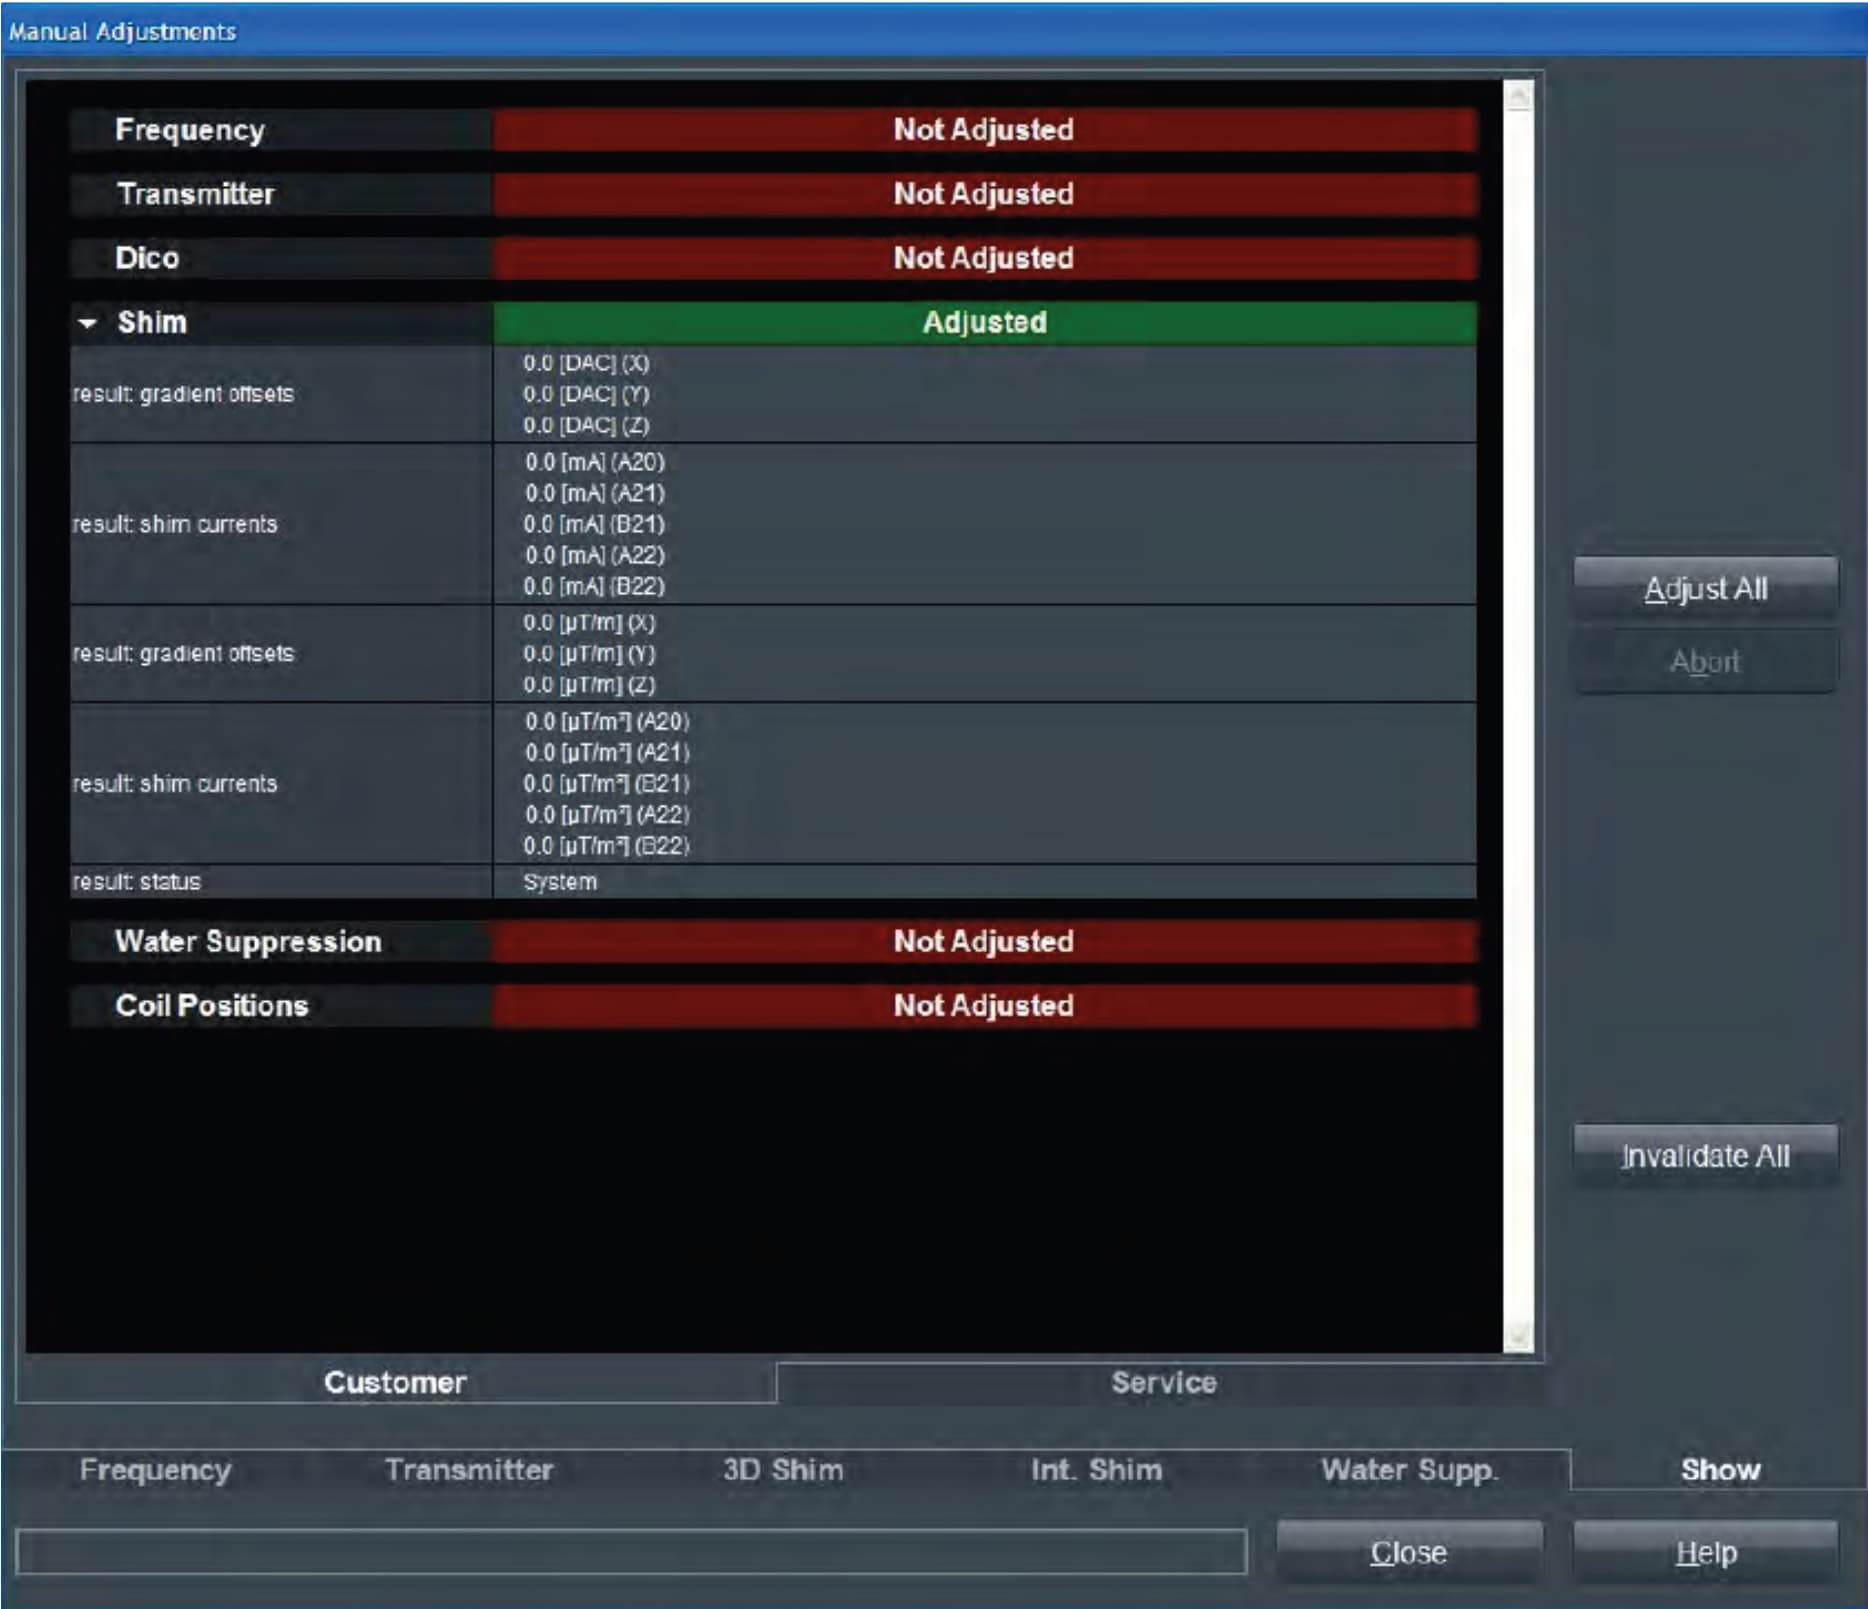
I just thought of the water suppression optimization - I believe I previously used to click “invalidate all” and then “adjust all” on the “Show” tab (see poor screenshot) which would relatively reliably take care of most of the adjustments - with what you have described, you may have to re-adjust the water suppression as well?