I am quite a newbie and I am playing with FID-A and trying to leran the pre-processing steps using the example code and example data that is provided in the repository.
I was wondering if I can ask a pretty basic question
I am looking at the data acquired using SPECIAL with 80 averages.
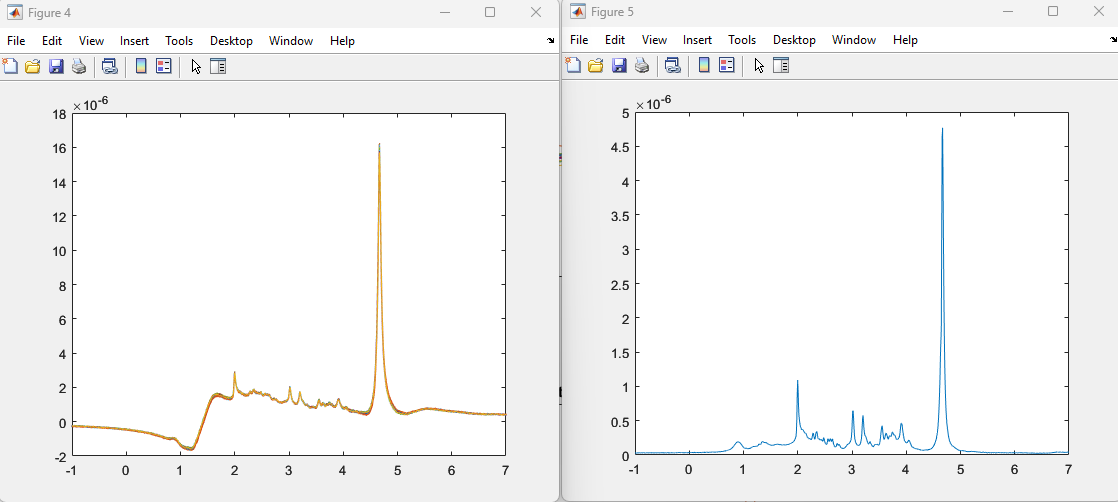
In figure 04, I have plotted all averages after phase correction and coil combination.
In figure 05, I have plotted the average of all spectra (shown in figure 04)
I was wondering why single spectra in figure 04 have that ramp from neg to positive around 0.5 ppm and how averaging operation removed that when all values are the same.
Are you sure you plotted all averages in Figure 4?
SPECIAL is a two-step experiment with two localized slab signals. The difference of these two is the one from your localized voxel.
I believe the op_plotspec function in FID-A prompts you whether you want to plot all averages (but then only plots the first sub-spectrum) or all sub-spectra (but then only plots the average of the two sub-spectra).
This is all from FID-A repository.
I am running its example code (in exampleRunScripts), on the existing examplary dataset ( exampleData) inside the Repo.
I am running run_specialproc function, which does the full processing on the special data:
Calculate the information for phaseCor and Coil combine from the water data:
coilcombos=op_getcoilcombos(op_combinesubspecs(out_w_raw,‘diff’),2);
Apply phase correction and combine coil channels:
[out_cc,fid_pre,spec_pre]=op_addrcvrs(out_raw,2,‘w’,coilcombos);
if water
[out_w_cc,fid_w_pre,spec_w_pre]=op_addrcvrs(out_w_raw,2,‘w’,coilcombos);
end
Average and combine the subspectra:
out_noproc=op_combinesubspecs(op_averaging(out_cc),‘diff’);
if water
out_w_noproc=op_combinesubspecs(op_averaging(out_w_cc),‘diff’);
end
In figure 4, I am plotting out_cc.specs(:,:,1), which shows all 80 averages for one sub-spectrum.
In figure 5, I am plotting out_noproc(:,1), which shows the average of all averages and both subspectra.
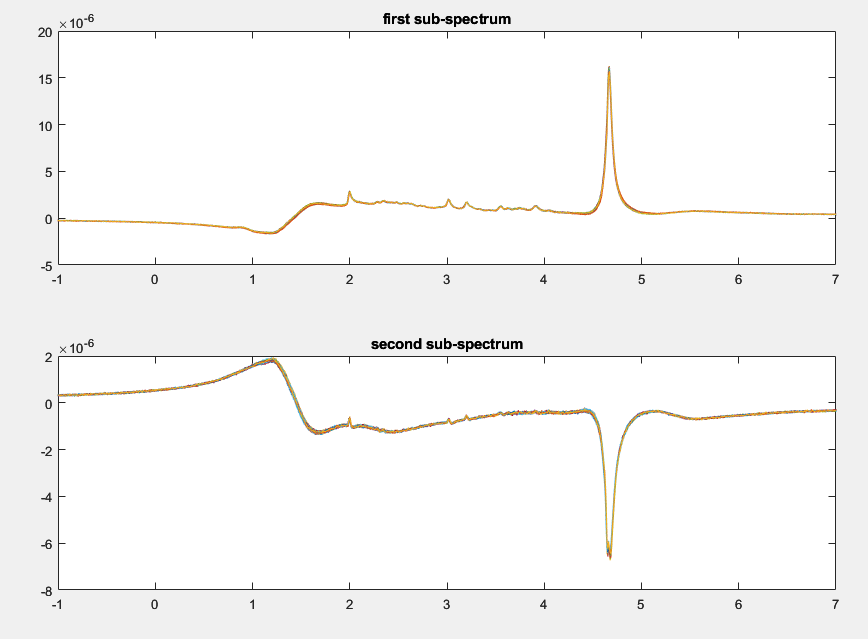
I think during explaining for you I realized that maybe that ramp is gone because I am combining both sub-spectra in figure 05.
This is the plot of 80 averages of the first and the 80 averages of the second sub-spectrum:
But still don’t understand what is the reason for that. Is it normal to see this in Special sub-spectrum? Do we see this in individual averagse in other sequences like semiLASER?
Yes - SPECIAL is a two-step localization experiment, basically acquiring signals from two slabs, one of which gets hit with a slice-selective inversion pulse along the third direction. This means that the signal from inside the voxel has opposing phase for the two halves, while the signals from outside are in phase.
Subtracting the two will retain the (opposing-phase) signal from inside the voxel, but remove the (in-phase) signals from outside. (You can also obviously invert one of the spectra and sum them up - you can see that nicely in your new plots, the metabolites are in phase, while the broad background is out of phase).
In contrast, sLASER, PRESS, STEAM etc. all achieve single-shot localization, i.e. the signal for each transient only comes from the intersection of the three slice-selective pulses.