Hello, everyone! I am currently a newcomer to MRS and I am in the process of utilizing Osprey and LCModel to analyze my data. Now I met some problems about baseline.
The baseline I’m referring to is an estimate of the metabolite composition within a sample, derived through a fitting process in MRS analysis. It is generated using mathematical modeling and optimization techniques.(Because I don’t know its exact name)
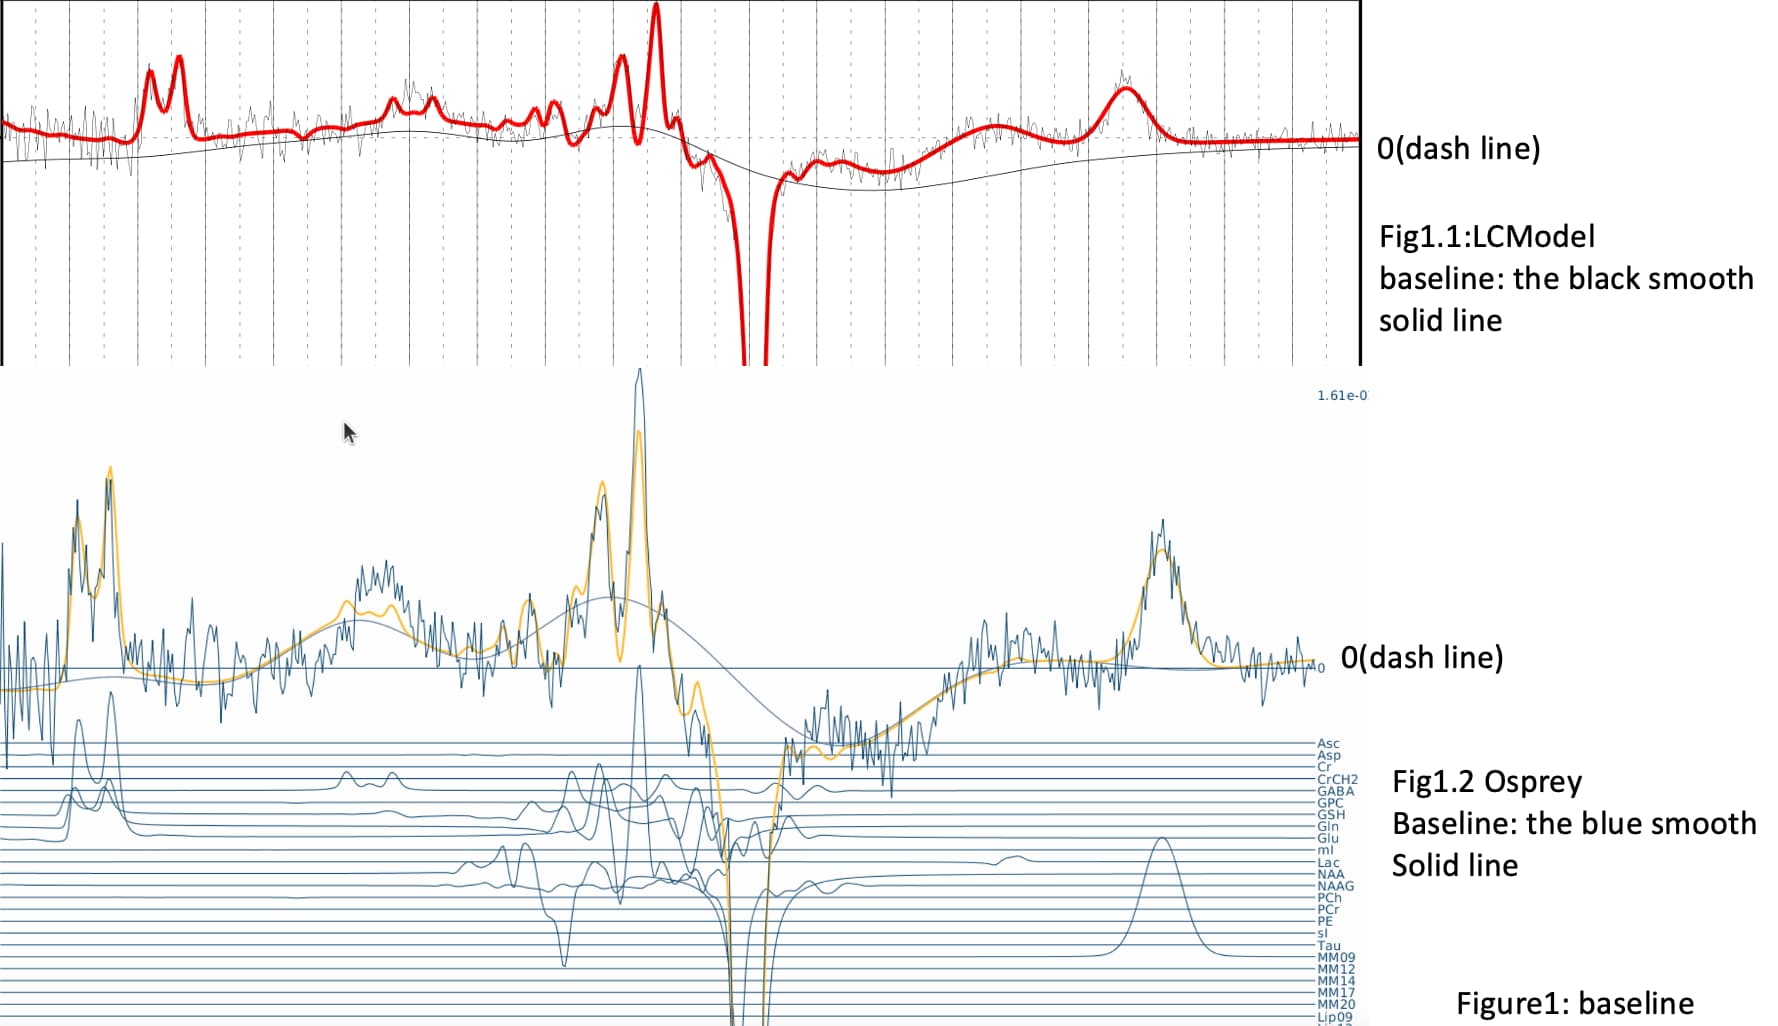
When comparing the baselines generated by LCModel and Osprey:
LCModel’s baseline appears relatively smooth with minimal fluctuations from the baseline of 0.
In contrast, Osprey’s baseline exhibits more significant volatility.
I want to know the reason why they are different.
(Figure 1)
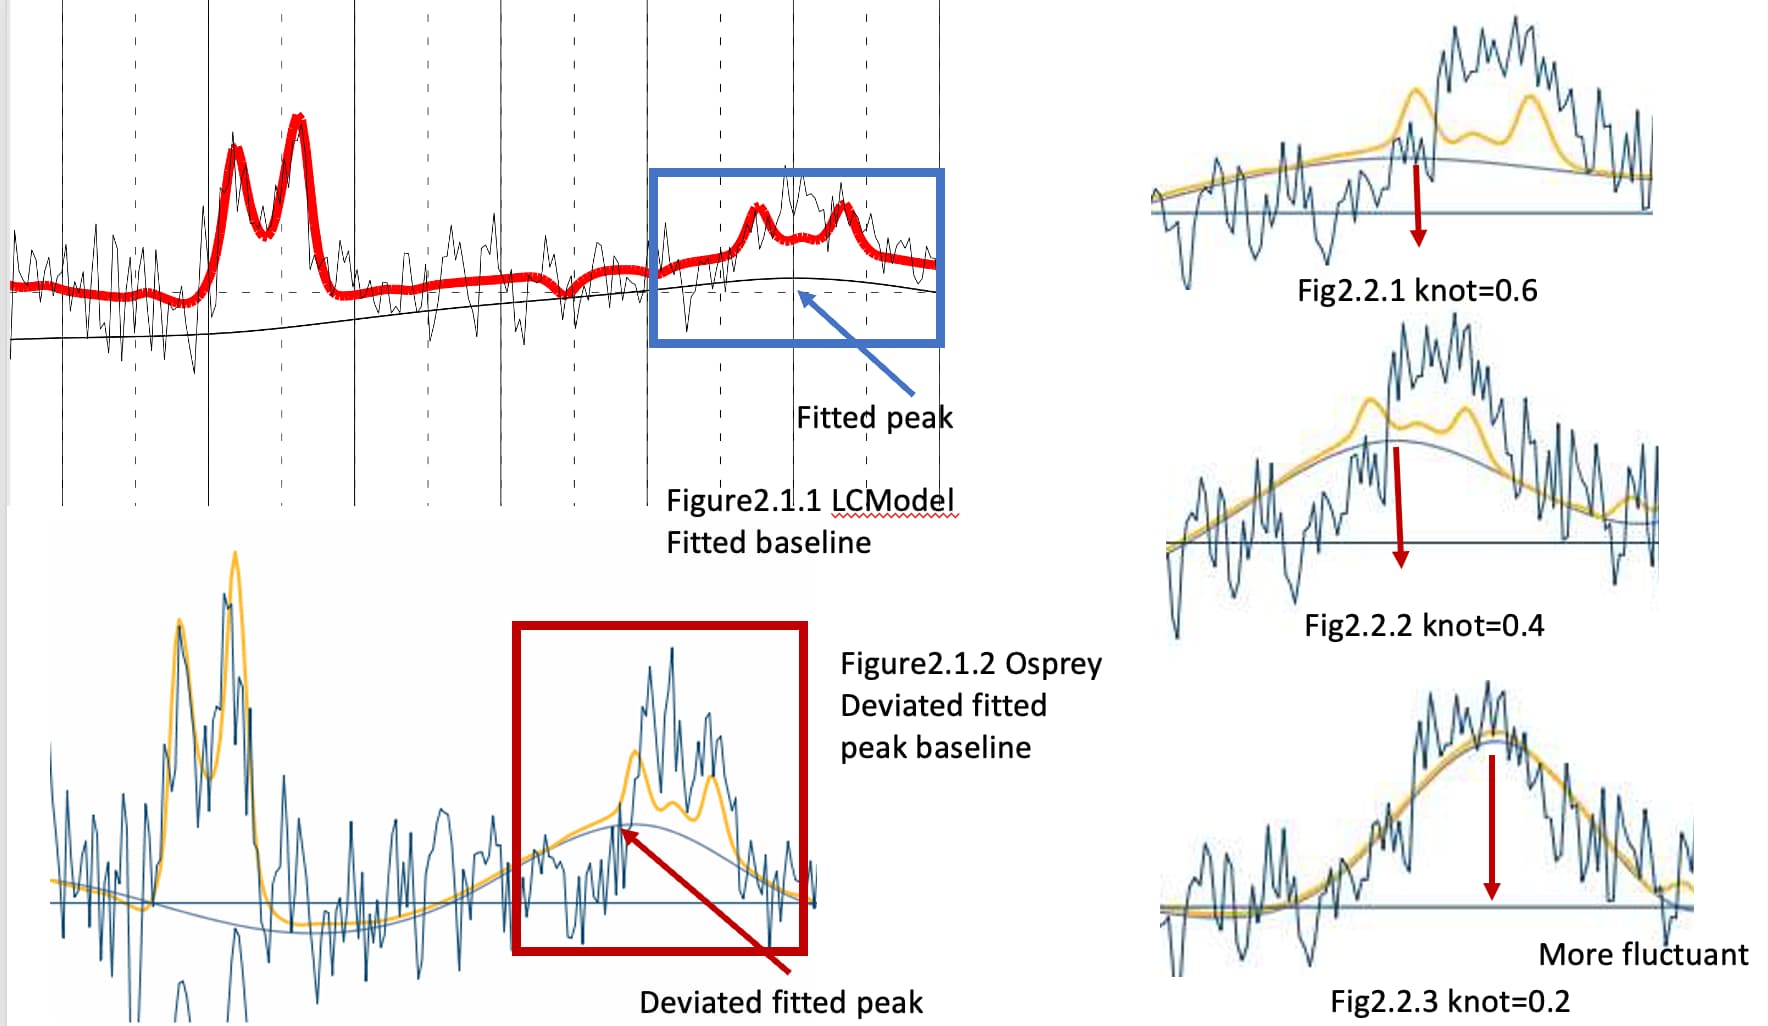
GABA Peak deviation:
Notably, in LCModel, there is a small peak in the baseline corresponding to the positions of GABA, which suggests that LCModel’s fitted line aligns with the spectral lines from actual MRS data.
However, in Osprey, it appears that the fitted line deviates from the true peak positions of MRS data. And I modified the parameter knot parameters in Osprey, the deviated fitness didn’t change.(I modified the parameter in Osprey)
% Determine the baseline knot spacing (in ppm) for the metabolite spectra
opts.fit.bLineKnotSpace = 0.4; % [ppm] Default: 0.4.
I also want to know why Osprey has the deviated fitted baseline.
(Figure 2)
Hello @admin
I posted a question earlier but haven’t received a response yet. I think you might be able to answer this question. Could you please help me with the reason why the Osprey baseline has a deviation compared to LCModel? I would greatly appreciate it. Thank you in advance!
Fundamentally, that is because they are two different algorithms. Very briefly, LCModel regularizes the baseline amplitude estimates to encourage smoothness. Osprey doesn’t do that in its current release version (although we’re working on adaptive baseline fitting).
Thank you for your reply. I haven’t fully grasped the details of your suggestions regarding modifying osprey parameters. I will continue to explore and experiment on my own, and I’ll definitely reach out for advice if I encounter any challenges. Your insights are much appreciated!