Hi,
I am trying to create new basis sets and I’m not familiar with FID-A simulation. From previous discussions, it is indicated that we can use the fit_makeBasis functions in Osprey to create basis sets using *.mat files metabolites coming out of the FID-A simulations. However, I’m not getting these *.mat files, is there any help/guidelines to do it please?
Thank you for your help.
Salem
1 Like
Hi Salem,
Thanks for finding the MRSHub! You are right, by default the FID-A simulation structures are not saved externally (unless you write them into a .raw file). We have modified the start and the end of our own sim_PRESS scripts to define metabolite-specific filenames and then use MATLAB’s save command to save the out structs created by FID-A as .mat files at the end of the scripts, like this:
% ********************PARAMETERS**********************************
% Spin system to simulate
spinSys     = metabolite;
out_name    = ['Philips_PRESS_' spinSys '.mat'];

...
...
here's where all your simulation stuff happens
...
...

out.name=metabolite;
save(out_name,'out');
The second-to-last line created an additional field in the FID-A struct carrying the spin system name, which also doesn’t happen by default (it’s a useful addition for us).
Does that make sense?
Once I get my grant submitted, I should finally get to that blog post / example simulation script that I’ve been wanting to make for a long time. 
Cheers,
Georg
1 Like
Hi Georg,
Hi all,
Thank you so much !
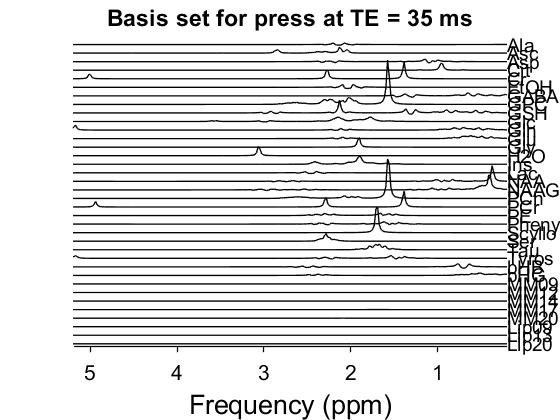
your suggestions were very helpful and i created basis set (for 1.5 T MRS data) but it looks strange since peaks are not at the right ppm. it seems like that all peaks are shifted of about 2 ppm. do you have an idea where it comes from?
Please find attached the plot of this basis set.
Any help is appreciated.
Salem
1 Like
Hi Salem,
That looks promising! I’m almost certain that this shift occurs due to the center frequency parameter of your FID-A simulation (which describes the carrier frequency of the pulse; @JamieNear once explained to me that he took a bit of an abbreviation of implementing this by shifting the simulated spectrum). Unfortunately, FID-A doesn’t save the center frequency to the output structure in its current version, so Osprey makes an assumption if it can’t find a field called centerFreq in the struct (I believe that the assumption is 3 ppm, but I’d have to double check). If you simulate it with a different center frequency, you might end up with a shift like this. One workaround is to add a line saving the centerFreq parameter as out.centerFreq to your simulation code - Osprey should pick it up then. I can dig up my own simulation code tomorrow if you need a pointer.
Let me know if anything is unclear, happy to circle back and help out.
Best,
Georg
Hi Georg,
Thank you again for your precious suggestions.
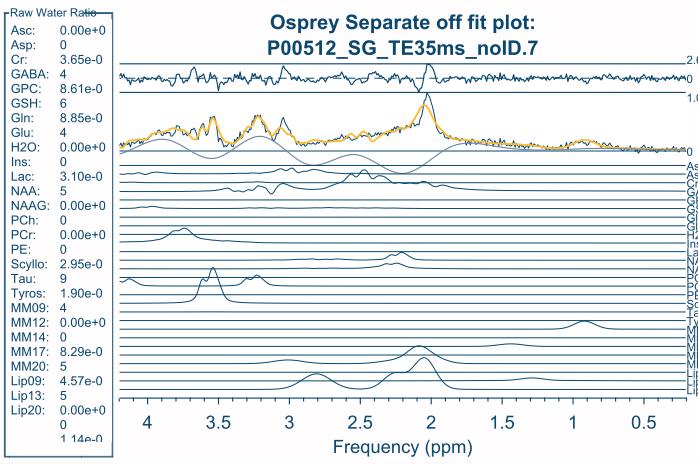
I shifted the center frequency ( set at 3 by default) and the basis looks better (please see figure below). However, the quality of the fit was very bad (with different data set) using this basis set although all input simulation params (n, sw, etc…) were correct (please see the figure below).
I can share my anonymized data and my basiset to may be check it please?

Thank you in advance for your help.
Best,
Salem
Hi Salem,
The basis set looks better, but it is still off by about 0.3 ppm. The NAA singlet should be at 2.01 ppm, and the Cr methyl singlet at 3.02 ppm. Did you re-simulate with a different center frequency, and save the center frequency parameter, or did you manually try and shift it? (I should finally fix the basis set generation in Osprey, I just haven’t quite come around to it yet. cc-ing @Helge too).
cheers,
Georg
Hi Georg,
I re-simulate with a different center frequency and saved the BASIS.centerFreq too. I’ll correct the shift of 0.3 ppm and try the fit again.
Thank you for your spent time and help.
Salem
hi,
i saw this discussion, wanted to ask something and then I forgot :(, sorry
in the figure with the fit plot there is a very strange contribution from H20? is this normal?
best
cristina
Hi Cristina,
I wouldn’t pay too much attention to the fit plot, that fit was done with a severely off-resonance basis set (and the fit range didn’t include water at all). The stack plots you see are not fit results, but simply visualizations of the basis set after import to Osprey (using the fit_plotBasis command), so the simulated H2O signal is included in there.
Best,
Georg
1 Like
thank you for the details 
cristina
1 Like
You can now use MRScloud for this purpose: https://braingps.mricloud.org/mrs-cloud
2 Likes
Hi Koen,
Thank you for the recommandation, it is quiet easy to use.
With the MRScloud, the B field seems to be set to 3 T? How can i use the MRScloud to create basisets at 1.5 T please?
Dear Salem,
I have no experiences with the 1.5T and I’m afraid I can’t help you with this matter.
Kind regards,
Koen
1 Like
Hi Salem,
I think there is no direct way to simulate 1.5 T data with MRSCloud via braingps.
But the code is open access: GitHub - shui5/MRSCloud: MRS Simulation. Maybe you can set in line 15 in run_simulations_cloud.m Fieldstr = 1.5 and for input you can use a .json file from simulations at braingps. I suggest this way is only possible for Universal pulse sequences (Universal Philips/Siemens) because the vendor pulses aren’t open access.
Best,
Heiner
@Salem, the timings (TE1/TE2), waveform and duration of the rf pulses would be different for 1.5T. Which vendor are you using?
Thank you for your reply.
Best regards,
Salem
Dear Heiner,
Thank you for this suggestion, i will try it.
Best,
Salem
Hi Steve,
Here are the parameters i want to use to simulate LCModel .BASIS :
vendor= GE
B field= 1.5 T
Pulse sequence= unedited PRESS
Number of points in FID = 2048
Spectral width in [Hz] = 2500
TE = 35 ms ==> TE1= 17.5 ms; TE2= 17.5 ms;
Best,
Salem
Please try the attached .basis file. It was generated using the parameters you listed above and the waveform and duration were “GE rfa167” and 6.5 ms. The basis function included the following metabolites: [“Asc”,“Asp”,“Cr”,“CrCH2”,“EA”,“GABA”,“GPC”,“GSH”,“Gln”,“Glu”,“Gly”,“H2O”,“Lac”,“mI”,“NAA”,“NAAG”,“PCh”,“PCr”,“PE”,“Ser”,“sI”,“Tau”]. Unfortunately, I am not able to share the vendor’s waveform.
Hope it works,
BASIS_GE_UnEdited_PRESS_TE35_wMM.zip (4.0 MB)