Hi everyone,
I am currently working on processing hepatic MRS data from 18 anhydrous phantoms (simulating Healthy, Steatosis, and NASH profiles) acquired on a Philips 3T scanner.
I have already performed spectral fitting using jMRUI and LCModel, and I intend to use TARQUIN and INSPECTOR for the quantification analysis. I am looking for a specific basis set that covers the main hepatic lipid resonances for my acquisition parameters.
Does anyone have a compatible basis set for these specific TE/Field parameters, or recommendations on how to best simulate these lipid chain systems for import into TARQUIN or INSPECTOR?
If you’ve successfully achieved fitting with jMRUI and LCModel, why would you want to use Tarquin or Inspector?
What is the difference between spectral fitting and quantification?
Could you post a screenshot of your data and some of the LCModel fits you’ve achieved? If the signals are broad, you can probably just fit them with simple Voigtians (much like LCModel fits macromolecules).
If you want to use actually simulated basis sets, you can look into SimnTG by @ouwerkerkr, although this tool will simulate the spectrum for an entire fatty acid (with configurable chain length and position of the double bonds etc.). The different groups/resonances likely have different T2s, and fitting a linear combination of rigid spectra will not be able to accommodate that unless you split the basis functions again. If you just want ratios between your target lipid resonances, it’ll probably be easier to use the approach I describe in 3)
It all depends on what you actually want to achieve, i.e., what your desired outcome variables are.
Thanks for the SimnTG recommendation, I will check it out.
Answering your questions and to give you some context, my work is a benchmarking study. My objective is to compare the performance of different free software for hepatic Magnetic Resonance Spectroscopy analysis and evaluate if they can accurately measure the lipid profile (saturation levels) compared to my Gold Standard/reference values in a 3T clinical setting.
Regarding my data, my phantoms are precise mixtures of commercial fatty acid standards (palmitic, oleic, linoleic, etc.) dissolved in chloroform (CDCl₃). These were chemically designed to mimic specific stages of liver disease (Healthy, Steatosis, and NASH), based on mouse model profiles from my supervisor’s paper (Xavier et al., 2019, DOI: 10.1039/c9ra08914d).
Regarding my reference values, we defined the standard using a Theoretical Protonic Matrix. We calculated the exact relative areas via matrix multiplication, weighting the proton contribution of each fatty acid according to its relative concentration in each phantom’s mixture. To verify the correct manufacturing of the phantoms, we acquired a representative subset of 9 samples in a high-field scanner (9.4T Bruker). Processing this data in MestReNova showed high concordance with our Theoretical Matrix. Therefore, we are using this Theoretical Matrix as our “Gold Standard” for the comparisons performed at 3T.
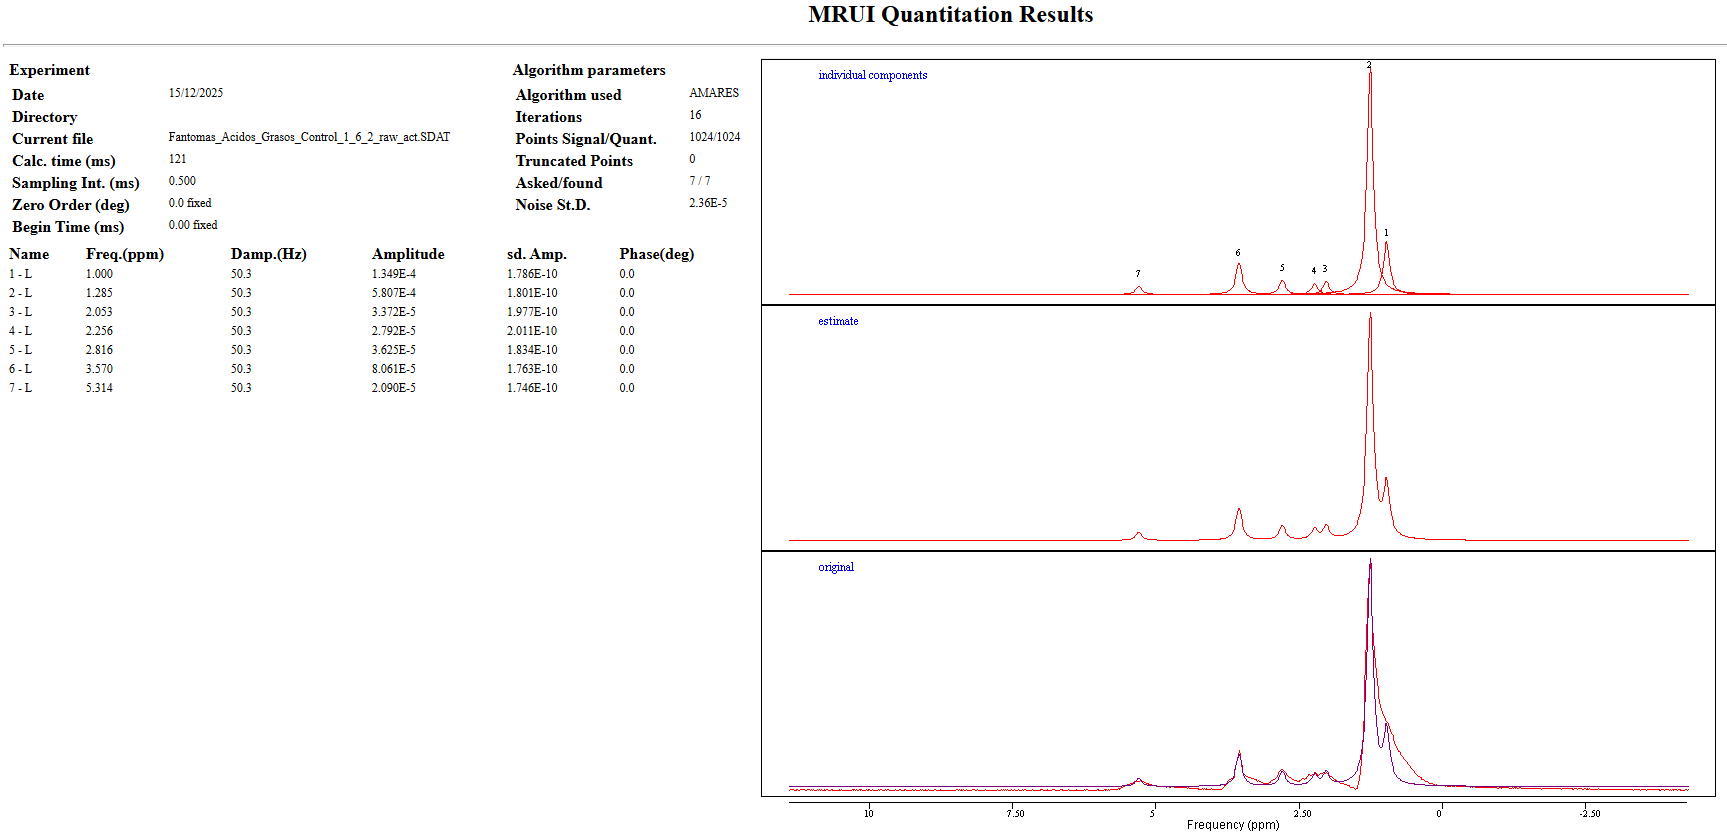
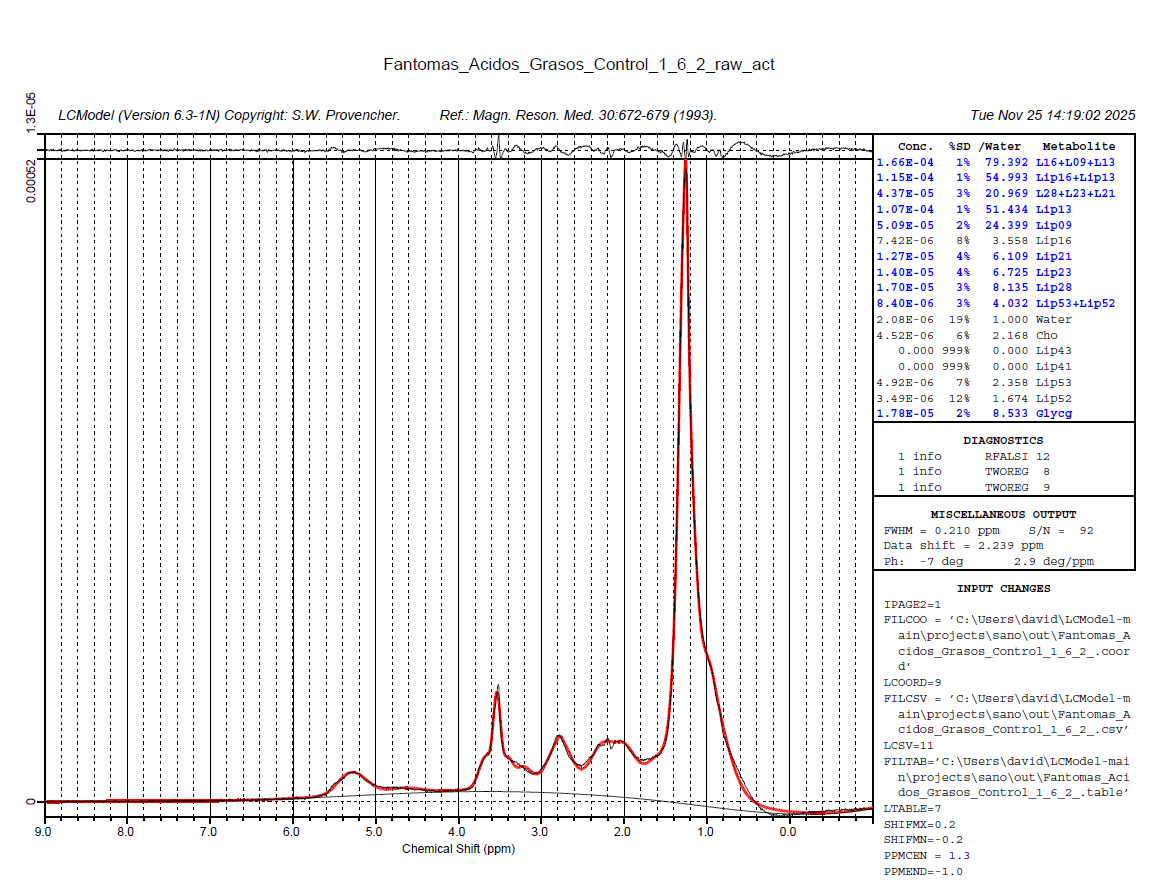
Regarding your second question, I understand that spectral fitting corresponds to the mathematical process of modeling the signal to minimize residuals, which is essential for resolving the superposition of my lipid peaks. Quantification, on the other hand, refers to translating those adjusted amplitudes or areas into concentrations or biological ratios.
I am attaching a screenshot with the results from LCModel and AMARES (jMRUI) for the same phantom.