I am a beginner in MRS signal processing. We have a 3T GE scanner that we use for scientific projects besides everyday clinical work. I use Osprey for quantification of the general MRS applications (PROBE-p TE=35 and 144). It works perfectly.
I am very much interested in 2HG quantification, and I set up a sLaser sequence with 110 TE for this project. I tried to simulate the basis sets using two different approaches:
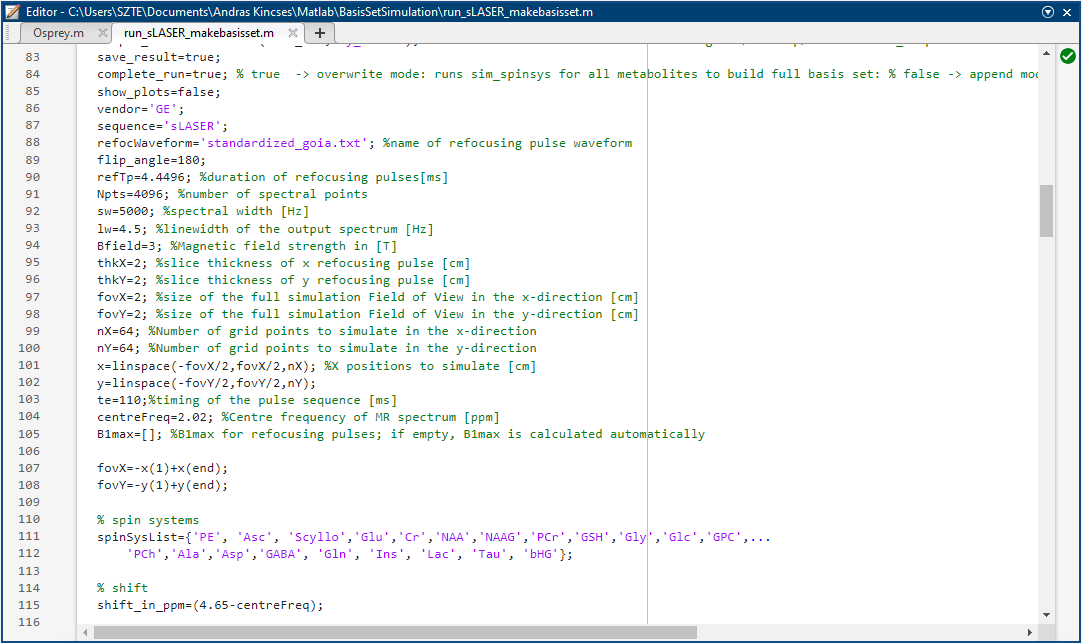
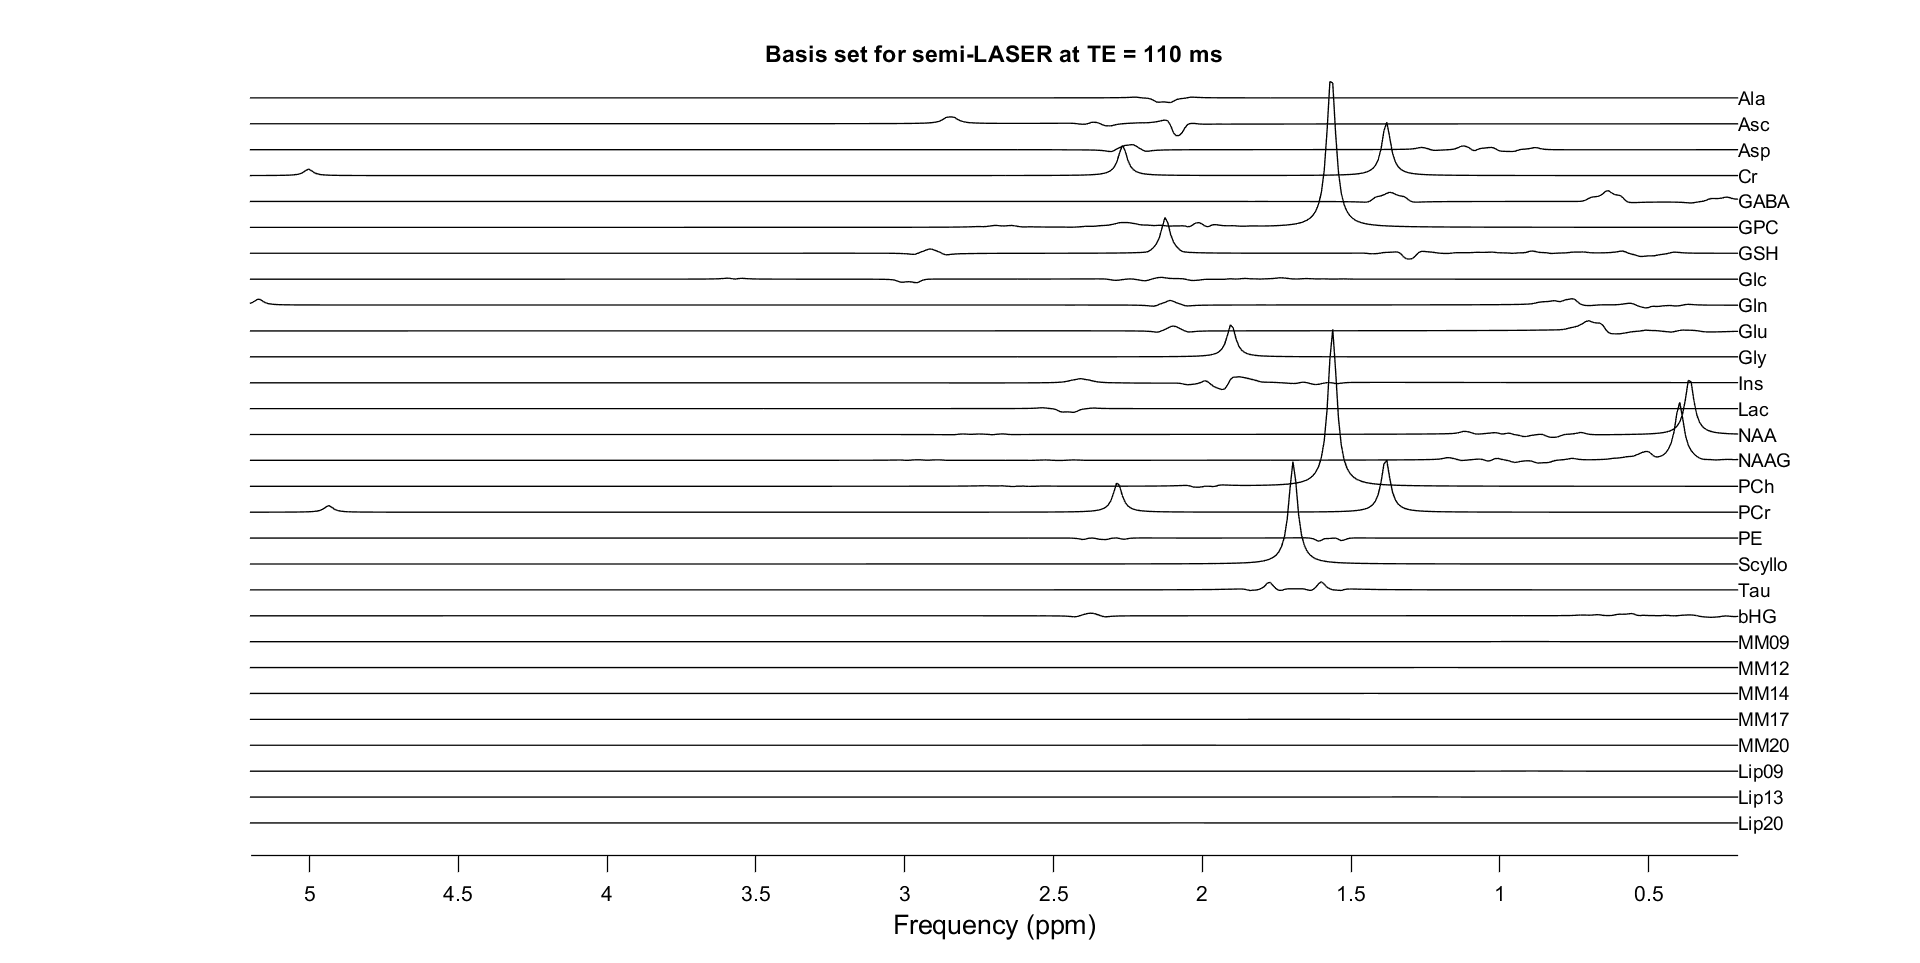
I used the MATLAB code BasisSetSimulation by Jessica Archibald. In this case, I received basis sets shifted by about -2ppm. I assume that the problem would be the center frequency; however, it is set to 2.02, which is the correct value in my case (if I am not mistaken…). Do you have any idea what could be the problem?
In parallel, I also tried MRSCloud. Unfortunately, I could not figure out how to transform the .RAW format to .mat. Is there any way to do it? In other basis set simulators, I had to be very specific with the measurement parameters, but not with MRSCloud. What is the reason for this? It didn’t even ask for the B0 field strength. Do I complete the “missing” data while applying the .RAW format?
Which one is the better, more reliable method? Do you have any further suggestions how I can progress?
I am happy to comment on our MATLAB BasisSetSimulation code.
From what you show here, I would first check whether you are plotting the final processed basis set or one of the intermediate MATLAB outputs. You can also look at the final generated .PDF
We’ve tested a simulation with your settings and the results look good.
There is a function in FID-A that can help you conver the .raw to .matinputOutput/io_readlcmraw_dotraw.m
Thank you for the suggestions!
I checked the final pdf and the individual metabolite spectra as well, and all of them seemed to be fine.
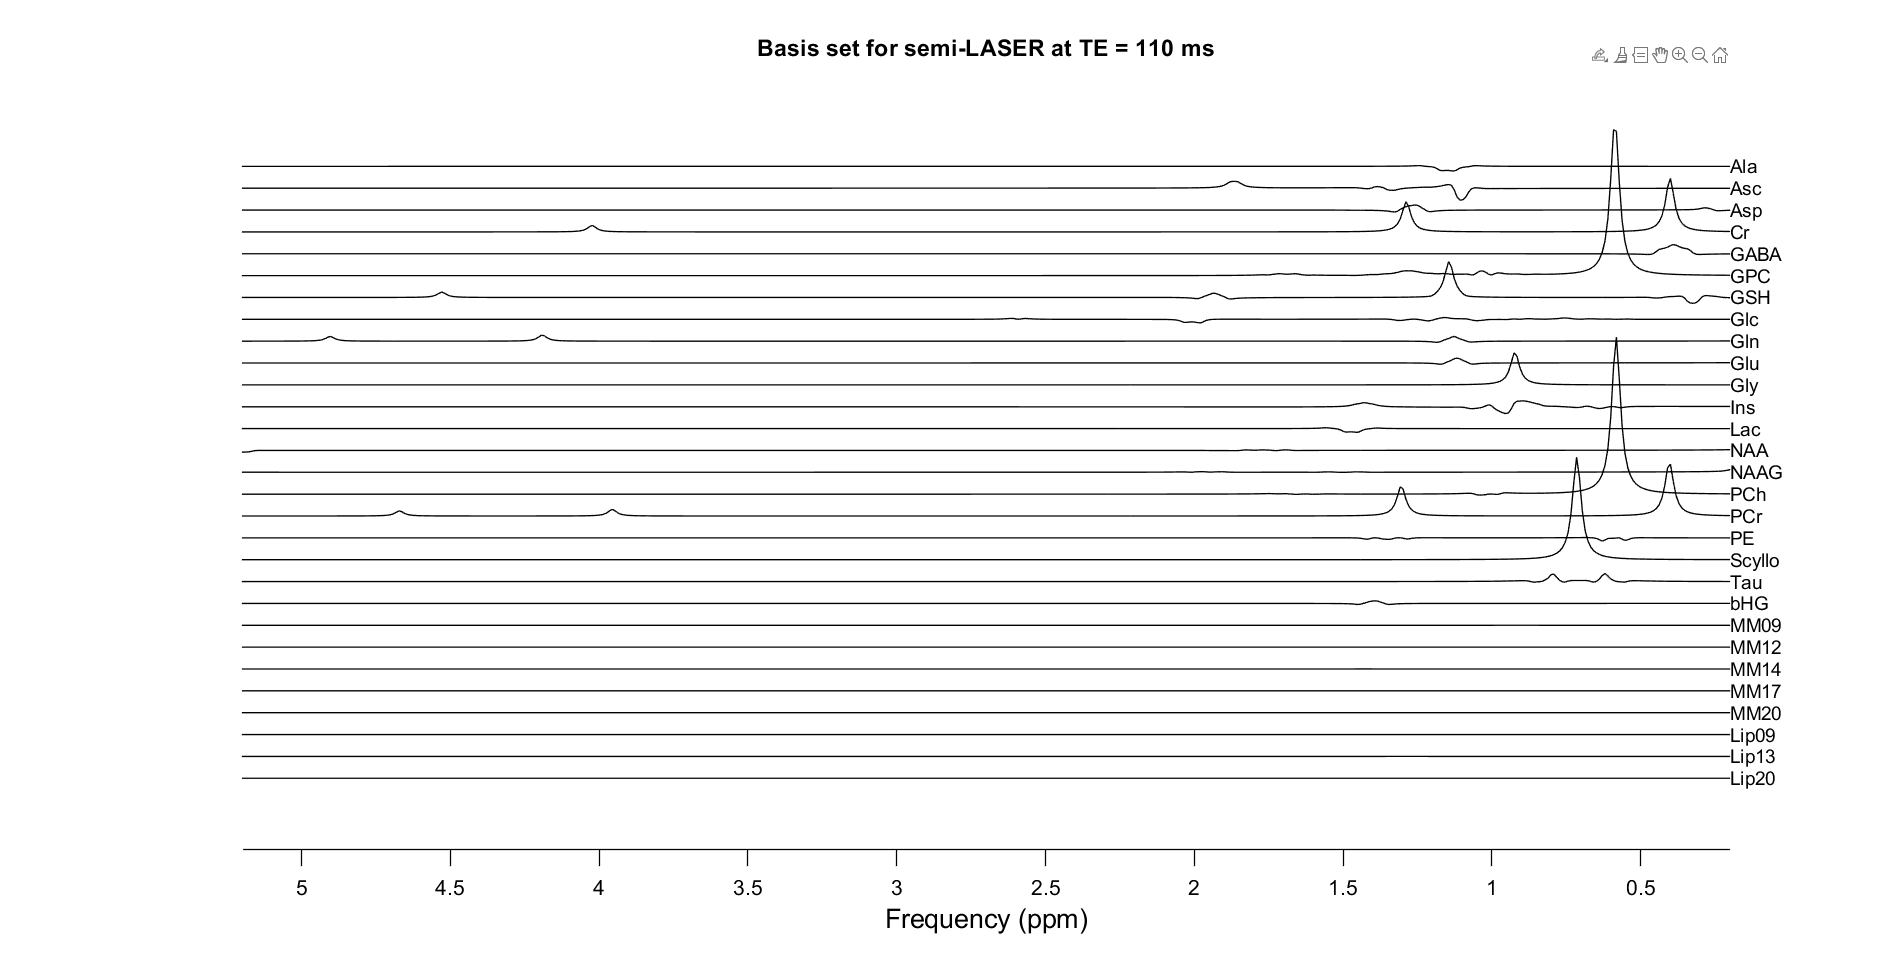
I used Osprey to create the basis.mat file for further application (fit_makeBasis.m). This is where the spectrum somehow shifts, I had attached that shifted plot to my original post. I also realised that your code has the centreFreq variable, while the Osprey code searches for centerFreq. When I replaced centerFreq to centreFreq in the Opsrey code, the spectrum is shifted even more to the negative direction (see below). If I understand well, this is because the code uses a preset centerFreq=3 in the absence of centerFreq tag.
I guess I can simply try to find a certain centerFreq to get the proper sperctrum, but I am not really convinced by the precision of this strategy. Do you have any idea how I should progress?
Thank you very much for your help! The fitting worked properly with the io_LCMBasis.m function. Finally, all the peaks seem to be in the correct locations.