Bugs and questions

Dear @admin and @Helge ,

  1. I changed, with the previous version of Osprey, the range of the HSVD water filter from [4.6 4.8] to [4.5 4.9]. The fit is much better.
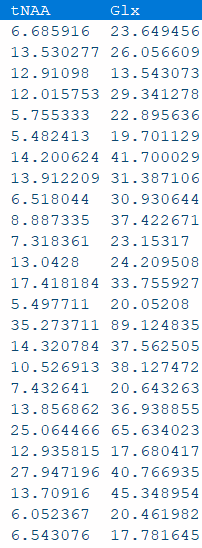
    Nevertheless, I found strange data (figure below). As far as I know, the [tNAA] > [Glx], but I did not find this in my data. Do you have some idea to explain that?

  1. Where is it possible to find the quality-control data from each spectra, for example in the overview section?

  2. With the last release of Osprey, I obtain an bug directly after the OspreyProcess function:

Undefined function or variable ā€˜osp_lcmcontrol_paramsā€™.
Error in osp_saveLCM (line 53)
LCMparam = osp_lcmcontrol_params(MRSCont.flags.isMEGA);

Error in OspreyProcess (line 99)
[MRSCont] = osp_saveLCM(MRSCont);

Thank you and I appreciate any reply.

Frederic

1 Like

Hi Frederic,

  1. As far as Iā€™ve seen in the data you shared with us you are struggling with a relatively broad linewidth. You do not happen to have the raw TWIX files from your spectra, as the pre-processing with a spectral registration technique usually does a better job than the on scanner averaging. This could improve your linewidth, as this seems to be the main reason for the insufficient modelling. Could you also share some of the extreme cases (35 89 and 25 65)?

  2. In the current implementation, you should be able to look at correlations between metabolites and SNR/LW in the overview tab. Iā€™m working on a csv output and a raincloud overview for these values as well. Iā€™ll let you know as soon as Iā€™ve implemented those changes. If you want to access them now, these values are stored in MRSCont.QM.A within the container.

  3. Can you look for the osp_lcmcontrol_params function in the Osprey/process folder, because I can localize it on GitHub and it is working fine for me.

Best,
Helge

1 Like

Thanks for your quick reply @Helge,

  1. You can find the data here (thank you for the help you can provide). Indeed, I donā€™t have the raw TWIX files.

  2. Ok. I am looking forward for the next implementation!

  3. Indeed. It was due to a wrong path in matlab. However, I obtain now a new error, during the Coreg process:

[MRSCont] = OspreyCoreg(MRSCont);
Error using <
Comparison between string and double is not supported.

Error in osp_Toolbox_Check>@(a)~isempty(a)&&a<1 (line 67)
available(find(cellfun(@(a)~isempty(a)&&a<1,enabled)), : ) = ;

Error in osp_Toolbox_Check (line 67)
available(find(cellfun(@(a)~isempty(a)&&a<1,enabled)), : ) = ;

Error in OspreyCoreg (line 41)
[~] = osp_Toolbox_Check (ā€˜OspreyCoregā€™,MRSCont.flags.isGUI);

Do you know why? I suppose an error with the SPM path.

Thanks once again!

1 Like
  1. Iā€™ll take a look at your data and let you know if we come up with a solution.

  2. This was a known MATALB version related bug. Iā€™ve just uploaded a fix for this bug on GitHub. Let me know if this works for you.

1 Like

Hi @Helge

1.Did you made any update about my strange value?

  1. I have a new bug with the last version:
[MRSCont] = OspreyOverview(MRSCont);
Reference to non-existent field 'inProgress'.

Error in OspreyOverview (line 87)
    progressText = MRSCont.flags.inProgress; 
  1. Moreover, the command of the gui seems undefined (I check the path, and it seems to be ok):

gui = OspreyGUIapp(MRSCont)
Undefined function or variable ā€˜OspreyGUIappā€™.

Sorry to be omnipresent, I really want to share my MRS data estimate by Osprey in my lab.

Best,
Frederic

Hi Frederic,

Thanks for your new bug reports, they are very useful during the development of Osprey.

  1. I have not looked into your strange values so far.
  2. I think this was introduced due to releasing only parts of the recent development branch with the last fix. I have just updated the repository and the GUI should be fully functional. You should also see a SNR and FWHM csv file after running OspreyProcess. In addition, these values are accessible as raincloud plot and during the correlation plots (Iā€™m aware of some bugs in the pull down menus of the correlation tab). You can also switch on an automated PDF output in the jobFile with MRSCont.opts.savePDF = 0;
  3. We have changed the name of the GUI to OspreyGUI (gui = OspreyGUI(MRSCont) and OspreyStartUp to Osprey.

Iā€™ll keep you posted on your strange values.

Cheers,
Helge

1 Like

Thanks for all this update Helge.
With this new version, the data fit better than in the oldest one.

However, at the end of the process (OspreyOverview), a new bug appear:

Undefined function or variable 'lgamma'.

Error in betapdf (line 60)
                  + lgamma (a + b) - lgamma (a) - lgamma (b));

Error in betainv (line 87)
    h     = (betacdf (y_old, a, b) - x) ./ betapdf (y_old, a, b);

Error in finv (line 58)
  inv(k) = ((1 ./ betainv (1 - x(k), n/2, m/2) - 1) * n / m);

Error in regression_line_ci (line 43)
Yoff = (2*finv(1-alpha,2,N-2)*SE_Y).^0.5;

Error in osp_plotScatter (line 153)
    [~, ~,~] = regression_line_ci(0.05,b,x_tmp,y_tmp,cb(g,:));

Error in osp_plotModule (line 580)
                        fig_hold =
                        osp_plotScatter(MRSCont,split_which{1},split_which{2},metab,MRSCont.QM.SNR.A','SNR
                        Subspectrum A');

Error in OspreyOverview (line 774)
        osp_plotModule(MRSCont, 'OspreyScatterOverview', 1, 'off-tCr', 'tNAA', 'SNR');

Moreover, and it is a suggestion to use your software in scientific article. Your quality file is good, but according the last article of Martin, quality control requires consideration of (1) SNR, (2) metabolite and unsuppressed water resonance linewidths, (3) residual water signal, (4) line shape, (5) CramĆ©rā€Rao lower bounds (CRLBs) of the data fit, (6) fit quality (relative size of residuals versus noise SD).

Thus a lot of work for the future of Osprey! :wink:

Cheers,

Fred

Can you give the latest update a try, because the bug you are reporting should be fixed by now.

Thanks for your suggestions on other quality parameters to include, we are definitely considering to include them in a future release.

Cheers,

Helge

Same bug for the lastest version (downloaded today). But accordinf to GitHub, your latest commit was made 5 days ago.

Any update for my strange data? :wink:

Cheers,
Frederic

Ok. Could you try the commit from today?

We have a larger dataset with a similar issue at hand and are currently doing some digging on it.

Helge

1 Like

The last commit works well; thanks Helge.

Do you have an idea when it will be possible to find the issue out? I have to introduce my data to my lab the next week.

Cheers,

Frederic

I have quantified the data that you have shared with me in Tarquin to figure out if this is an Osprey related issue, but Glx > tNAA was also reported in Tarquin. So my guess is that this is just true for your data and not an issue of the linear-combination algorithm itself. This is possibly related to the linewidth of your data and how this interacts with the linear-combination algorithm. Also I do not think that these values are unreasonable.

As I said, we will try to improve Osprey with regards to spectra with broader linewidths, but Iā€™m not sure how this would impact the outcome of your data.

I donā€™t know how far you are down the line with your study, but Iā€™d advise you to store TWIX data or DICOMs with single averages in the future. I can also help you set up and optimize your protocol, if you think that would be helpful for you.

Best,
Helge

Thanks for your patience and kindness Helge.
To be honest, I had already tried Tarquin and LCModel with my data (if I have time, I will try them with jMRUI). I am in echo with you for the result reported in Tarquin. But it is quite different with LCModel (the baseline seems better and thus the quantification is quite different).

My study is complete, thus no possible to retrieve the TWIX data.

Best,
Frederic