Hello MRS Experts,
I am currently working with Osprey’s in-built LCModel for processing data from a 3T Siemens MEGA-PRESS sequence, focusing on quantifying Glx and GABA+. While Osprey has made the analysis more approachable, I have encountered some issues regarding data quality and exclusion criteria. I would greatly appreciate any insights or recommendations from the community.
1. FWHM of Spectra
According to Wilson et al. (2019), a linewidth of less than 0.1 ppm is recommended for accurate metabolite quantification. In my dataset, the Cr_FWHM extracted from the QM_processed_spectra for one subject is 12.97 Hz, which I calculated as approximately 0.105 ppm. However, the LCModel output for the same session shows differing values: 0.103 ppm in the Diff spectrum and 0.095 ppm in the A spectrum.
Question : Which FWHM value should be used for comparison against the 0.1 ppm criterion? Does this threshold apply to the Diff spectrum, the A spectrum, or both?
2. Cr Frequency Stability
In Song et al. (2024), the Cr frequency stability metric is reported with an SD less than 0.2. I’ve noticed that Osprey provides a “freqshift” metric within QM_processed_spectra, and LCModel outputs a “Data Shift” value in the diff1.table and A.table file.
Question : How is the Cr frequency stability metric typically calculated? Should I use the SD of the “freqshift” from Osprey’s QM_processed_spectra or the SD of the LCModel “Data Shift” values? Are these reported in ppm?
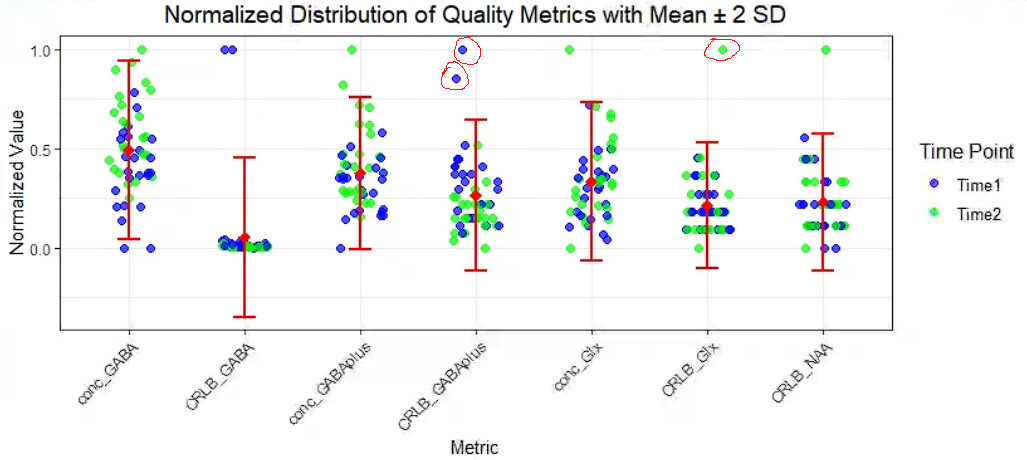
3. GABAplus Macromolecule Modeling
The default LCModel script uses the ‘3to2MM’ setting for macromolecule fitting in the GABA+ range, but this results in nearly half of my GABA estimates being 0. I switched to the ‘1to1GABAsoft’ model and added a 0.4 ppm baseline knot spacing, which improved the fits significantly. Now, only one subject has a GABA estimate of 0.
Question : Should I consider using the ‘1to1GABAhard’ model instead? It provides non-zero GABA estimates across all subjects, but this setting removes the GABA+ column in the Diff1 spectra quantification. Is this trade-off acceptable, or might it introduce other issues?
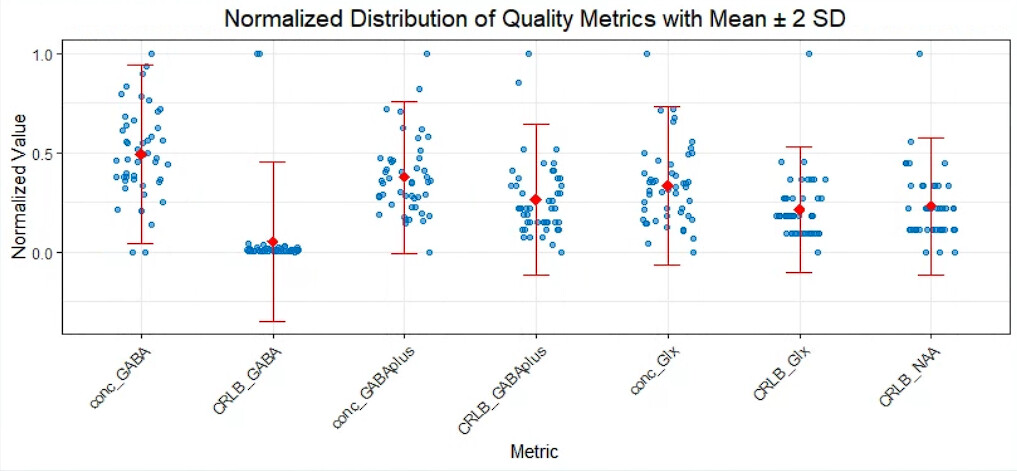
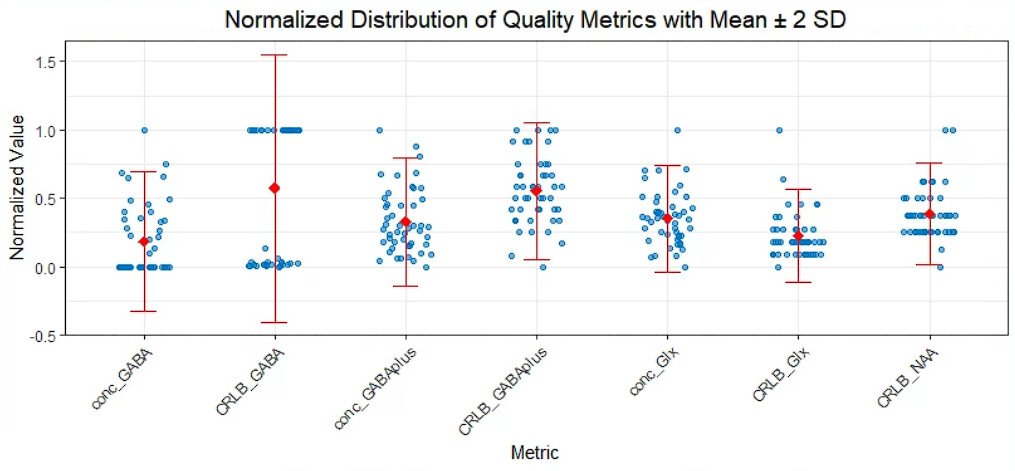
4. Metabolite-Specific FWHM and SNR
Unlike Gannet, I cannot find metabolite-specific FWHM and SNR values (e.g., for GABAplus or Glx) in Osprey. Rather, I only have access to the absolute CRLB values for each metabolite.
Question : Are metabolite-specific FWHM and SNR not available in Osprey’s LCModel output, or am I missing something? Is there an alternative way to extract these values?
5. Visual Inspection and Spectral Quality
I have identified one subject with notably poor spectral quality: the FWHM is unusually high compared to other sessions, and the chemical shift drift plot shows scattered points.
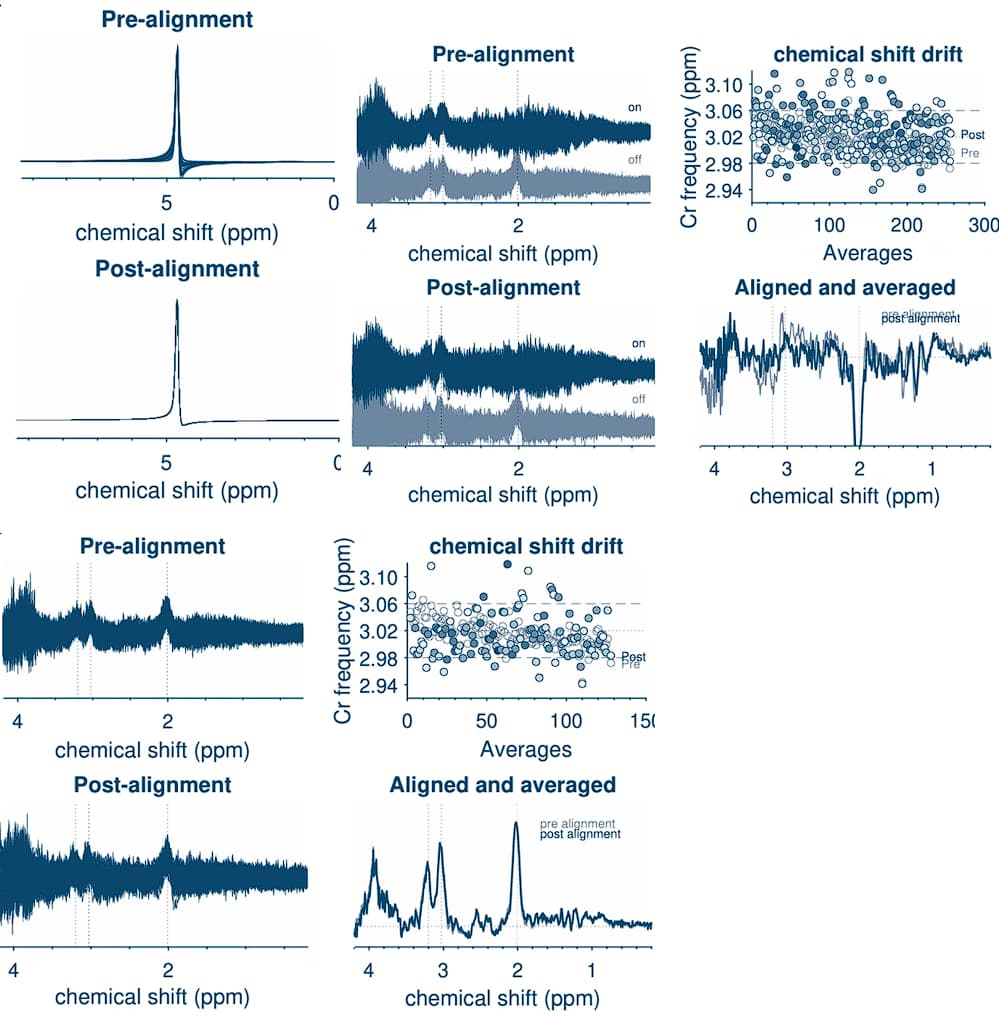
Question : Is there any additional processing I can apply to salvage this data, or should I exclude this subject entirely? Would you recommend any specific steps for improving the data quality in such cases?
Song et al. Brain glutathione and GABA + levels in autistic children. Autism Research, 17(3), 512–528.
Wilson et al. Methodological consensus on clinical proton MRS of the brain: Review and recommendations. Magnetic Resonance in Medicine, 82(2), 527–550.