Hi Admin,
Thank you so much for your detailed response—it’s been incredibly helpful for those of us relatively new to MRS. I also apologize for the delay in following up, as I’ve been testing new parameters for my data and organizing my thoughts. We would be very grateful if you could respond as quickly as you did last time.
Representative Data
All spectra were acquired from the mPFC region, with each subject undergoing two sessions.
Upon review, I noticed that the scan parameters for my MEGA-PRESS data weren’t optimal. Specifically, I found a delta frequency of -2.8 ppm in the water reference scan, a low TR (1500ms), and low averages (128), which differ from the consensus recommendations (e.g., Peek et al., 2023).
Despite this, I’m aiming to make the best of the available data. I tested various parameter combinations and found that changing opts.SpecReg from RobSpecReg to RestrSpecReg was effective. This adjustment, alongside using opts.fit.range [0.5 - 4 ppm] for fitting, generally produced smoother spectra for noisier sessions. It also reduced the overall residual (31.0% vs. 31.7%).
However, there are still cases where RestrSpecReg fails to fully resolve the spectra smoothly.
You can view examples of the improvements here:
RestrSpecReg_Improvement
As requested, I’ve attached some representative data, which includes concatenated output files for both mean and individual session data:
Overview_Data
MM Fitting Strategies
I also have some additional questions regarding signal quality and macromolecule (MM) fitting. I reran the analysis with the 0.55 ppm baseline knot spacing and compared two fitting strategies: 3to2MM and 1to1GABAsoft.
In the 3to2MM model, the macromolecule signal seems to override the expected GABA signal around 3 ppm. Below is a comparison of the fitted difference spectra for the 3to2MM, 1to1GABAsoft, and 1to1GABA models. The red fitted curve for 3to2MM shows only one bump at 3 ppm, whereas the 1to1GABAsoft model shows three bumps, which seems more consistent with the green average. Interestingly, the residuals for 3to2MM (30.0%) are slightly lower than for 1to1GABAsoft (31.0%). The 1to1GABAhard model, while missing the middle bump, has a lower residual than 1to1GABAsoft (31.6%).
You can see the fitting comparison here:
MM_fitting / Fitting Method
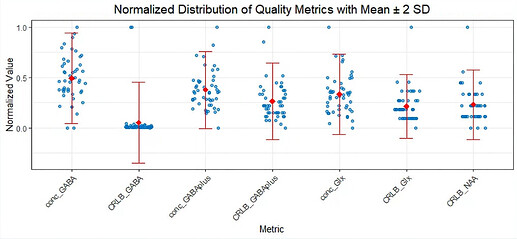
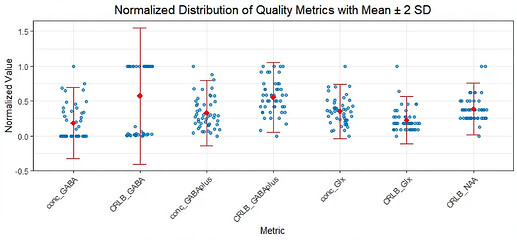
I’ve also attached a distribution of individual data points comparing the 3to2MM and 1to1GABAsoft fits (by Max-Min normalization). In about half of the cases under 3to2MM, the GABA concentration is zero, and the GABA CRLB value is set to 999. In contrast, with the 1to1GABAsoft fit, only one data point has a GABA CRLB value of 999, indicating a fit failure. However, two GABA+ CRLB values and one Glx value under 1to1GABAsoft are beyond the 2 SD range.
Distribution for 1to1GABAsoft fitting
Distribution for 3to2MM fitting
Additionally, I’ve uploaded two individual case fitting graphs for your review:
MM_Fitting / Clean_Compare
Each PDF page contains two spectra: 1to1GABAsoft on the left and 3to2MM on the right. These cases have smoother spectra compared to others, and as you can see, the 3to2MM model doesn’t utilize the GABA component for fitting at 3 ppm, being completely dominated by the MM09 peak.
Lastly, referencing a previous forum post, some users have found that 1to1GABAsoft might be more suitable for MEGA-PRESS data. Would this also apply to my case?
Forum Reference
CRLB Screening
We are applying a CRLB ± 2 SD cutoff to filter out participants with extreme data uncertainty. Among the GABA+ CRLB values, two clear outliers stand out. I’ve attached these flagged cases for your review, along with their respective fits under both the 3to2MM and 1to1GABAsoft models. Would you recommend excluding these data points?
Problem_Spectra / CRLB_Flagged
Potentially Noisy Spectra Without CRLB Flags
We’ve also identified several spectra that we are unsure about in terms of quality, even though they weren’t flagged by CRLB values. We’ve categorized these spectra to make it easier for you to assess:
- Sharp Spikes and Troughs
Some spectra exhibit rapid, sharp spikes and troughs. Are these spectra acceptable for analysis?
Problem_Spectra / Noisy GABA - Glx Unwanted Oscillations
For Glx fitting at ~3.7 ppm, some spectra show unwanted oscillations. Are these out-of-voxel artifacts that should be discarded?
Problem_Spectra / Noisy Glx - Baseline Spikes
In some cases, the baseline between Glx and GABA peaks includes large spikes. Are these spectra suitable for analysis?
Problem_Spectra / Noisy Baseline
Any insights or recommendations on how to proceed with these cases would be greatly appreciated. Should we exclude certain spectra based on these irregularities, even if they haven’t been flagged by CRLB?
Thanks again for all your help!

