Hello!
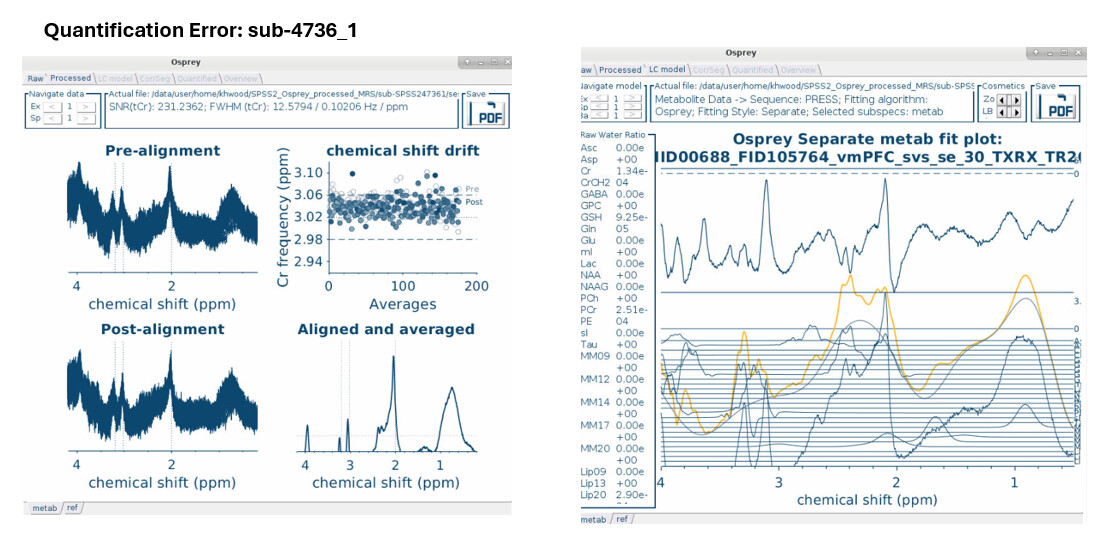
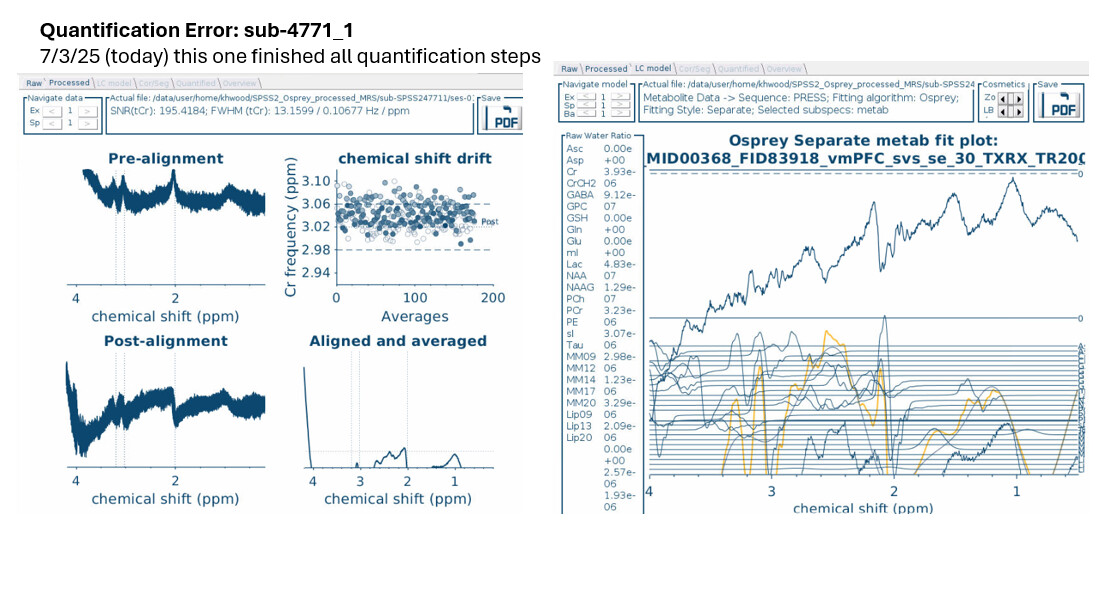
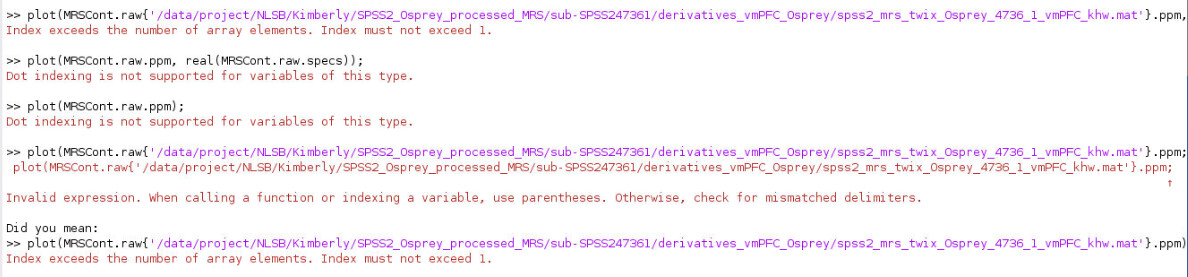
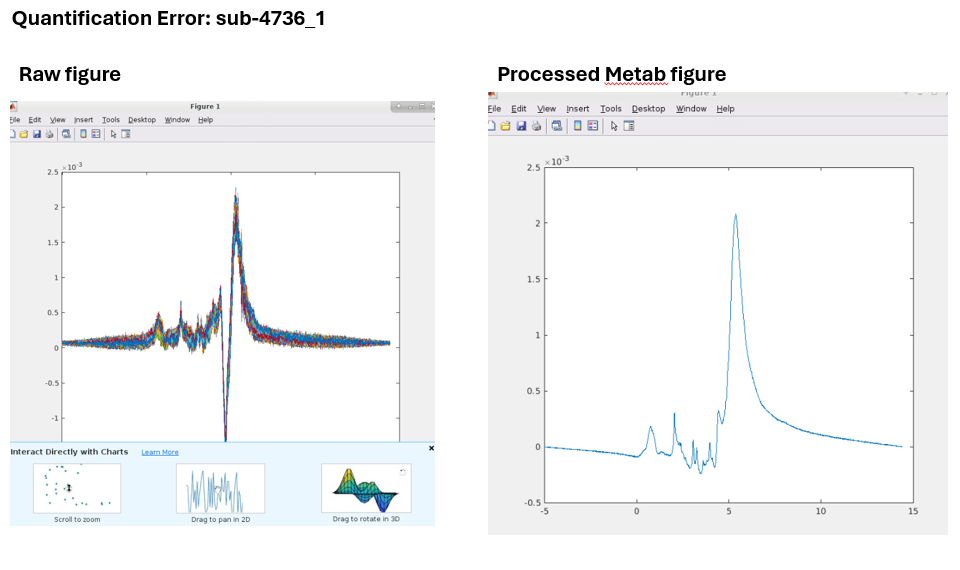
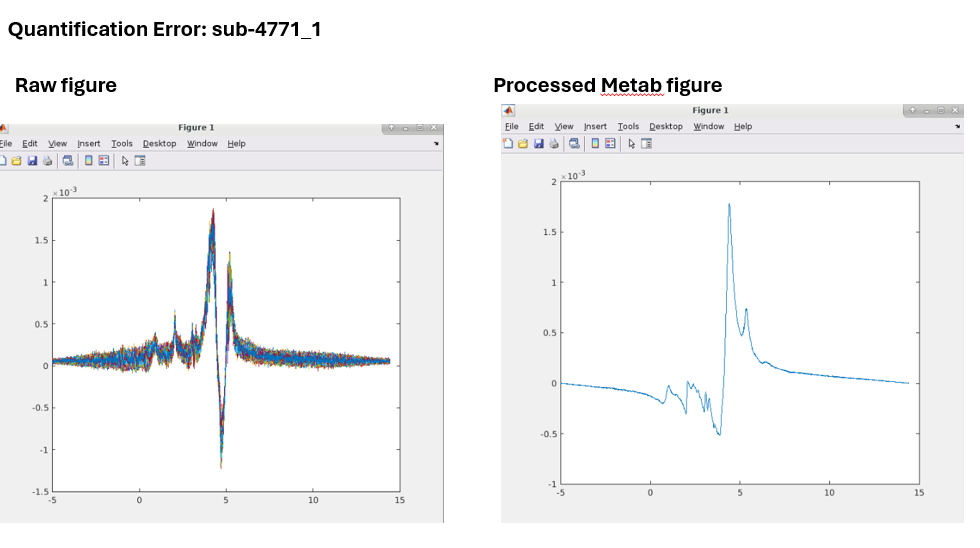
While running HERMES data, I ran into this error on the quantification step. The GUI seems to get stuck here. Any idea how to fix it?
Thanks!
Quantifying dataset 2 out of 2 total datasets...
... done.
Elapsed time 0.094643 seconds
Timestamp November 19, 2021 16:15:52 Osprey 1.1.0 OspreyOverview
Gathering spectra from subspectrum 8 out of 8 total subspectra...
... done.
Gathering fit models from fit 4 out of 4 total fits...
... done.
Interpolating fit models from fit 4 out of 4 total fits...
... done.
Scaling data from dataset 2 out of 2 total datasets...... done.
Elapsed time 0.835501 seconds
Runtime Breakdown................
OspreyLoad runtime: 58.861565 seconds
OspreyProcess runtime: 104.845057 seconds
OspreyFit runtime: 3000.307131 seconds
OspreyFit metab runtime: 2996.718079 seconds
OspreyFit reference runtime: 3.589053 seconds
OspreyCoreg runtime: 11.135346 seconds
OspreySeg runtime: 1851.878690 seconds
OspreyOverview runtime: 0.835501 seconds
Full Osprey runtime: 5027.957934 seconds
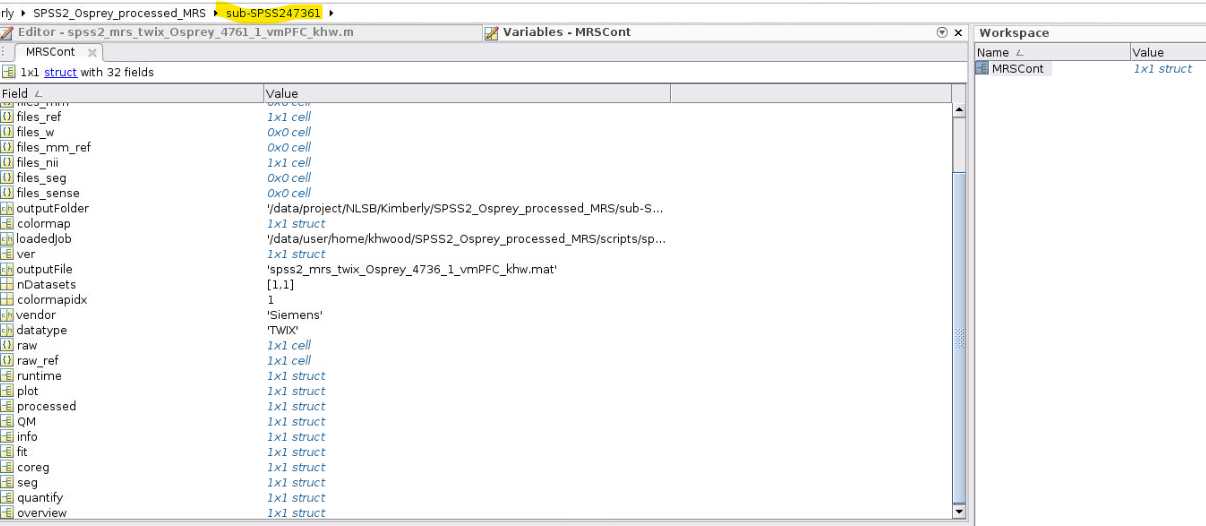
Reference to non-existent field 'sum'.
Error in OspreyMinReport (line 131)
strings = fieldnames(MRSCont.quantify.tables.sum);
Error in OspreyOverview (line 1239)
[MRSCont] = OspreyMinReport(MRSCont);
Error in osp_onQuant (line 46)
MRSCont = OspreyOverview(MRSCont);
Error while evaluating UIControl Callback.
Opening external nii viever...
... done.
Opening external nii viever...
... done.
Opening external nii viever...
... done.
Timestamp November 19, 2021 16:36:13 Osprey 1.1.0 OspreyQuantify
Quantifying dataset 2 out of 2 total datasets...
... done.
Elapsed time 0.051593 seconds
Timestamp November 19, 2021 16:36:19 Osprey 1.1.0 OspreyOverview
Gathering spectra from subspectrum 8 out of 8 total subspectra...
... done.
Gathering fit models from fit 4 out of 4 total fits...
... done.
Interpolating fit models from fit 4 out of 4 total fits...
... done.
Scaling data from dataset 2 out of 2 total datasets...... done.
Elapsed time 0.659060 seconds
Runtime Breakdown................
OspreyLoad runtime: 58.861565 seconds
OspreyProcess runtime: 104.845057 seconds
OspreyFit runtime: 3000.307131 seconds
OspreyFit metab runtime: 2996.718079 seconds
OspreyFit reference runtime: 3.589053 seconds
OspreyCoreg runtime: 11.135346 seconds
OspreySeg runtime: 1851.878690 seconds
OspreyOverview runtime: 0.659060 seconds
Full Osprey runtime: 5027.738443 seconds
Reference to non-existent field 'sum'.
Error in OspreyMinReport (line 131)
strings = fieldnames(MRSCont.quantify.tables.sum);
Error in OspreyOverview (line 1239)
[MRSCont] = OspreyMinReport(MRSCont);
Error in osp_onQuant (line 46)
MRSCont = OspreyOverview(MRSCont);