Hi,
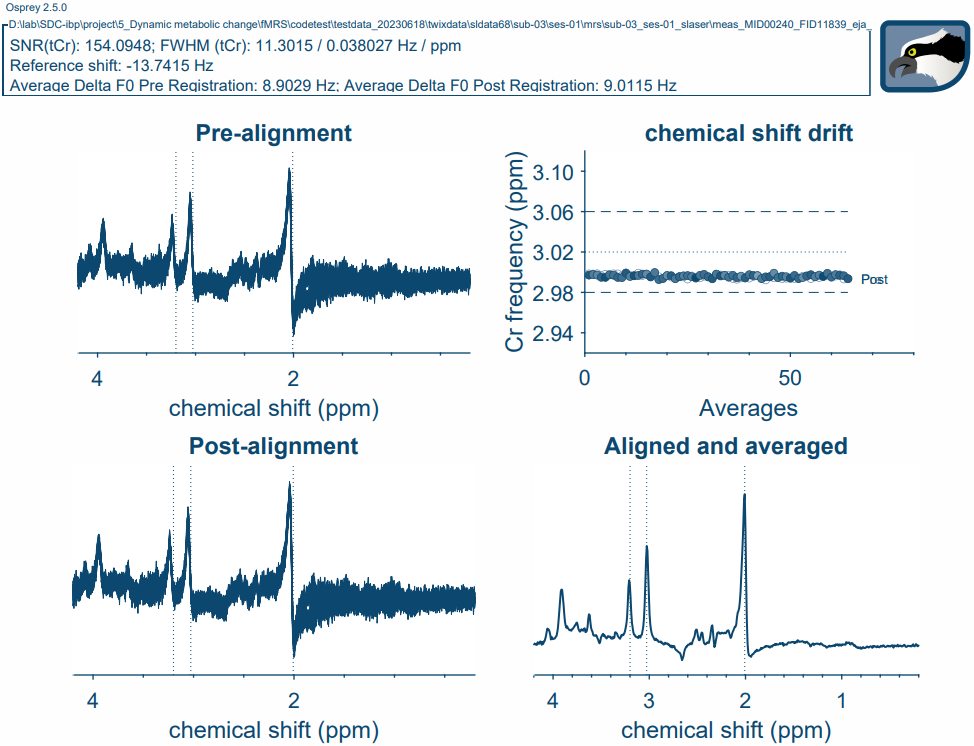
We have collected 1H MRS data in motor cortex with semi-Laser sequence with TE=68ms and 64 averages on a Siemens 7T scanner, after the automated prepocess pipeline with Osprey (including ECC) , we found the NAA peak is still asymmertric. I wonder if we need do some manual correction to make the processed data looks better?
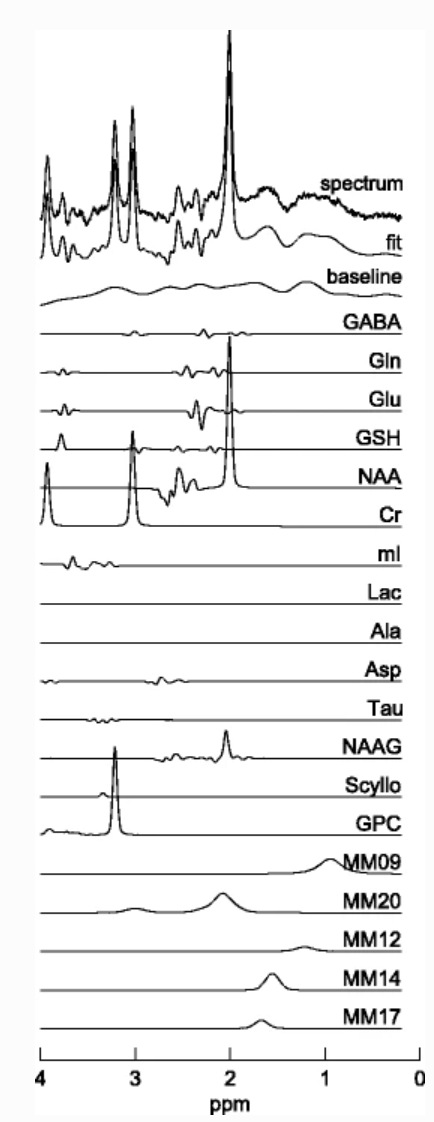
Here is the processed spectra:
I agree that the dip at 1.9 ppm looks a little off, but the rest of the spectrum looks almost perfectly phased. I would expect that the modeling will work just fine here.
Do you have a basis set? I don’t think we ship 7T sLASER for that TE with Osprey.
Hi,
Thank you for the reply. I think I don’t have a porper basis set now. I tried to use basisset produced by MRScloud, but I found it is simulated as B0=3T. So I’m trying to simulate basis set with FID-A, but I am now confused about which function should I use to simulate basis set for semi-Laser seuqnece.
Hi Chuyue,
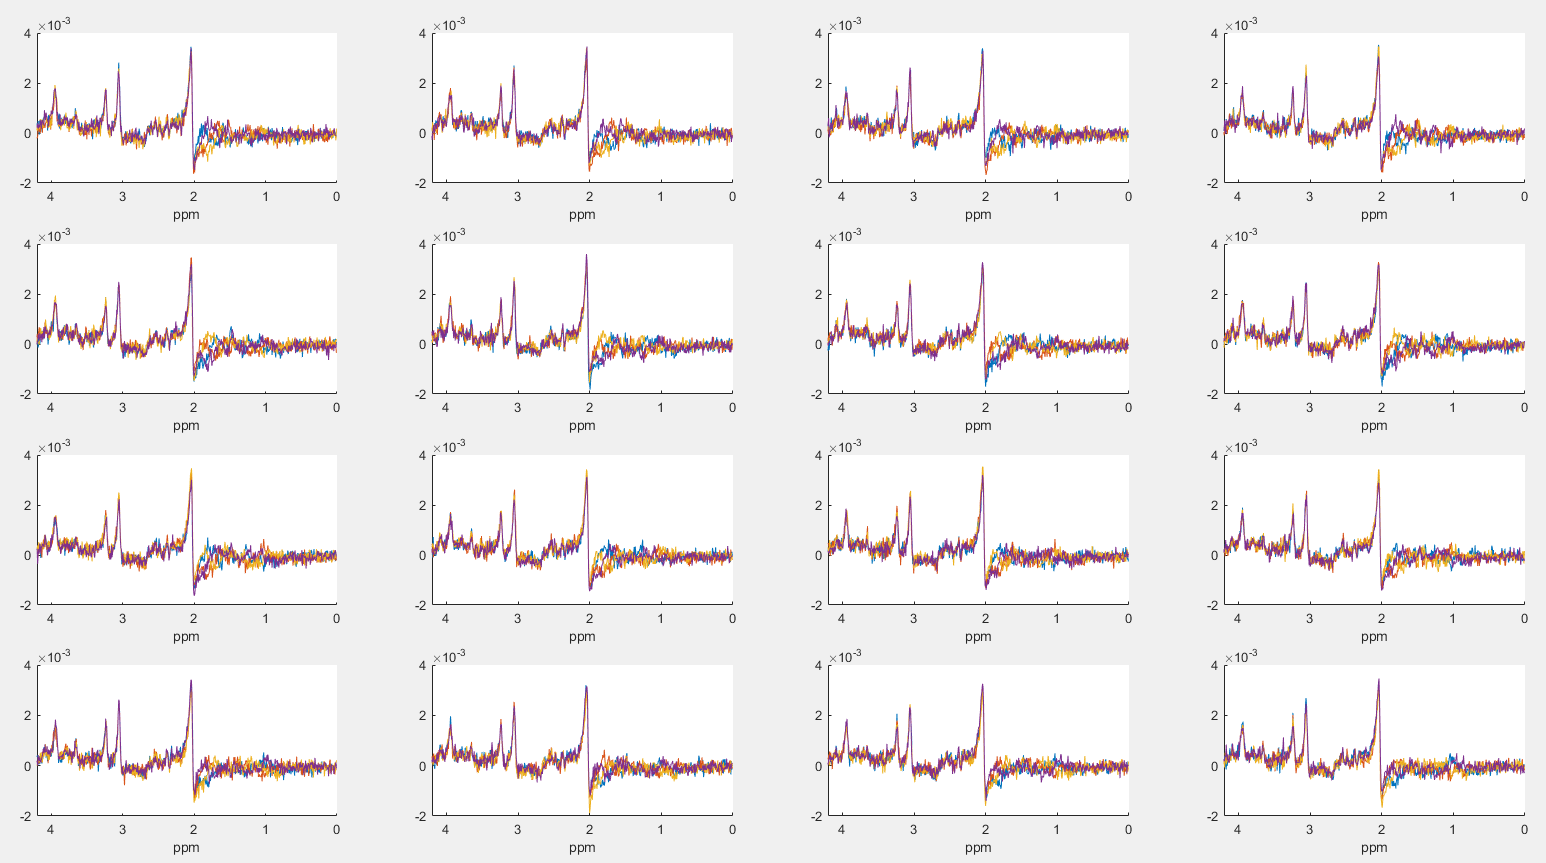
Your non-averaged data looks very noise at around 1.9ppm. But because of the little gap I would rather suspect that one half of your FIDs is lower and the other one higher. The lower part probably causes this asymmetry. Maybe you have to make a plot with your FIDs with different colors…
Hi Heiner,
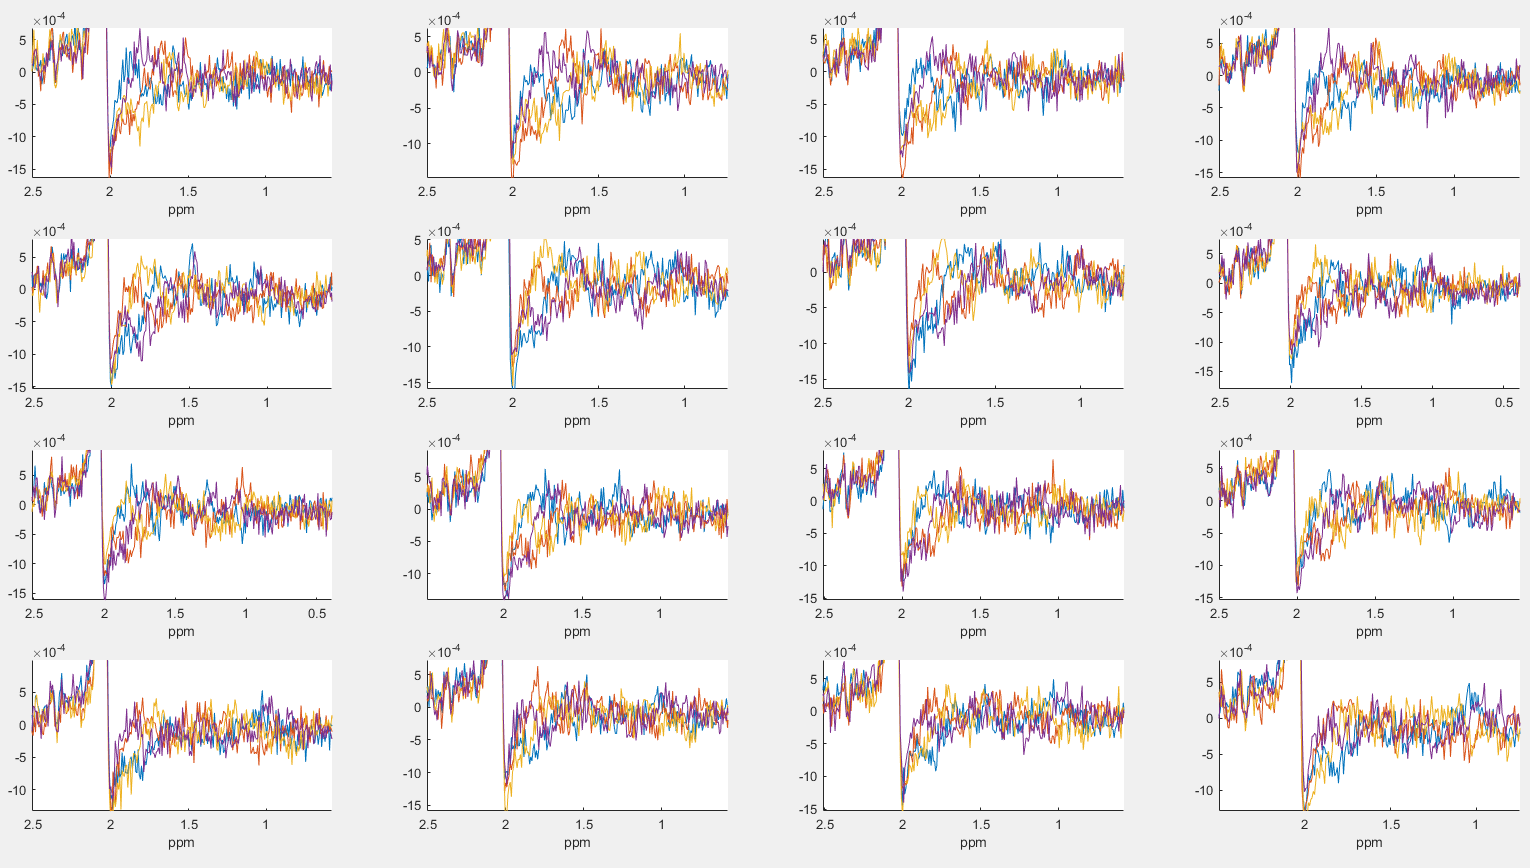
Thank you for the reply, I ploted non-averaged raw spectra and it looks like there are some differents patterns of spectra between 1.5 ppm to 2.0 ppm. But I don’t know how to interprete this differents and how to correct this.
Here I plot every 4 single spectra in a sub figure:
I’m not too familiar with the Siemens 7T platform, but a few thoughts:
Cho/Cr look well-phased; I believe these are the primary reference peaks used by Osprey to do the initial phasing, so that’s perhaps unsurprising.
I agree with @admin, the model will most likely be able to handle this reasonably well, especially if it allows flexibility in the phasing of individual components.
Lipid etc to the right of NAA (as suggested by @hraum) looks more stable than I would have expected – so I don’t think this is the issue.
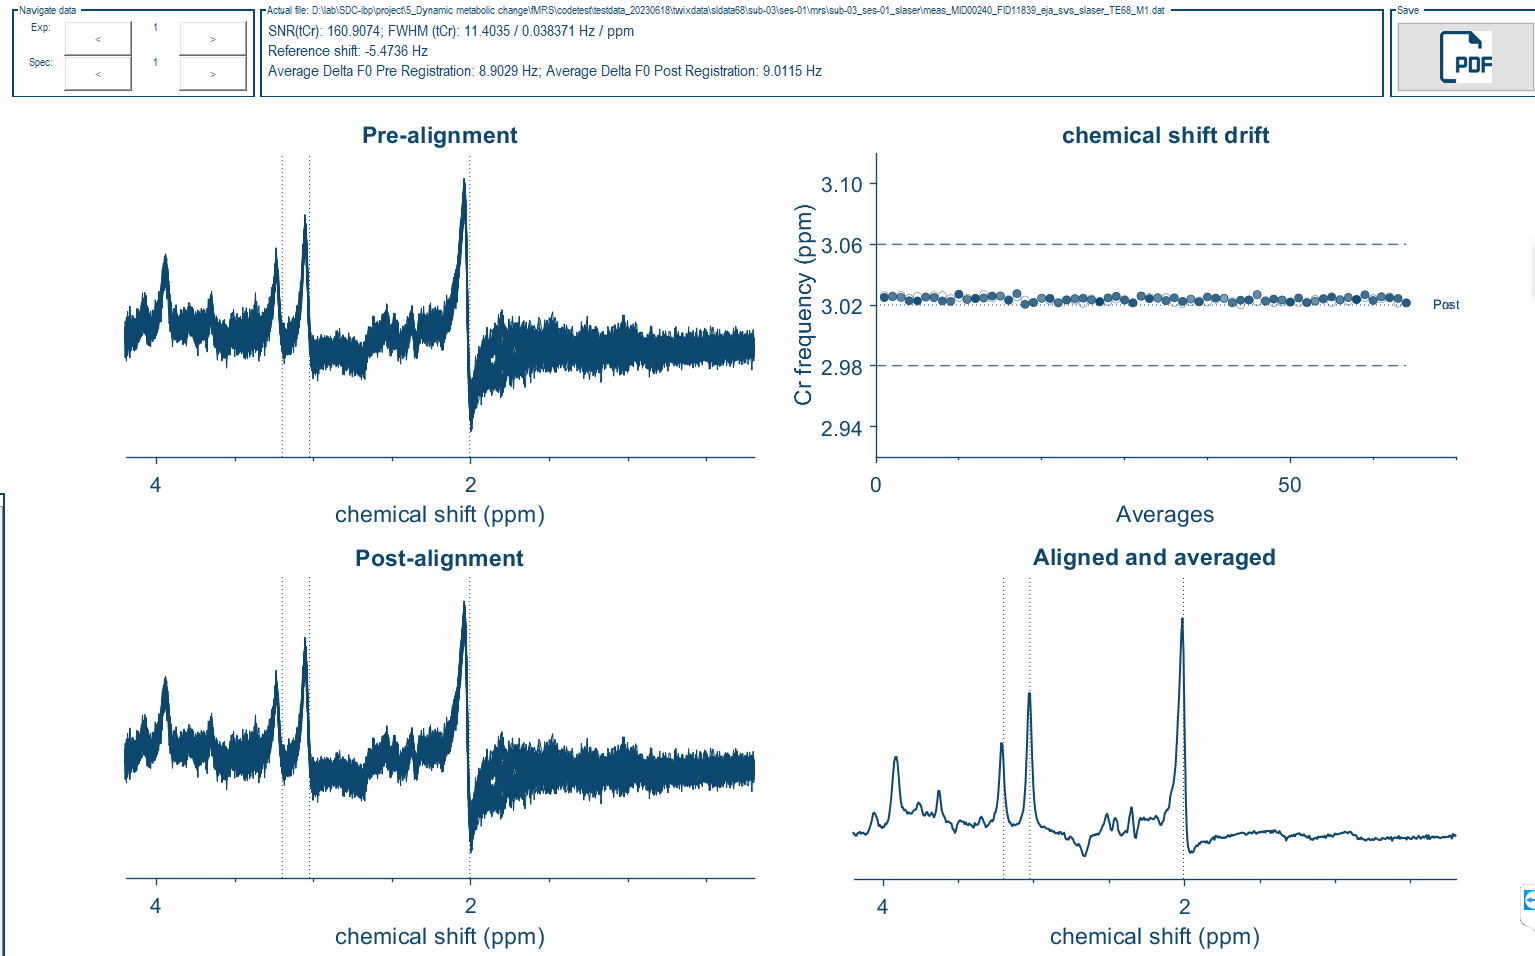
I find the sharp dip around 2.65 ppm more surprising, in conjunction with the odd shape around 1.9 ppm. Maybe I’m missing something, but could be some higher-order phase effects? Out of curiosity, what happens if you skip the ECC step?
Hi Chuyue,
I also wondered about the sharp dip that Alex mentioned but I’m not familiar with 7T. I also suggest that both artifacts are related. For a rolling baseline from phase effects other parts of the spectrum look too good. But I wouldn’t rule it out, as the spectrum between 1 and 2ppm also looks a bit strange. Spectra can also be distorted when there is an ADC overflow (see spectrum 10, NMR Artifacts).
Just to be sure, is this systematic across multiple subjects, or is it just one peculiar dataset? If it’s just one dataset, I would be wary of selective extra, manual (non-repeatable) processing…
I’d be curious to see what happens when you try to fit it.
We scanned two different subject, both of the subjects have 2 MRS scan with TE=42ms and TE=68 ms respectively. But all the processed spectra showed sharp dip around 2.65 ppm and 1.9 ppm.
@NSniper that brings me to the point - it will not be super straight forward to make that basis set for you. I think this is the CMRR sequence, and I do not have the sequence timings or pulse shapes for that sequence. Someone in your institution must have a so-called C2P agreement with the Minnesota people - I think the best thing would be for this person in your institution to reach out to them and ask for a matching basis set. (If all else fails, I can probably e-mail them on your behalf)
Thank you for the reply, I think Ican read the paper but I’m not very clear about how to simulate this effect. We used the CMRR sequence and have a C2P agreement. I’ll ask them for the matching basis set.