Hi, I have a question about water frequency.
I am currently a newcomer to MRS and I am in the process of utilizingGannet to analyze my data.
- Within the “GannetLoad.m” file, I’ve come across some code related to plotting water frequency in the “GannetLoad_output” file. I am curious about the precise purpose of displaying the water frequency. Does it solely indicate whether each transit is aligned or does it serve another function as well?
Furthermore, I am seeking clarity on the methodology employed to calculate the water frequency. Based on my interpretation of the code, it appears to involve several steps:
-
firstly, acquiring the spectral data for all transits;
-
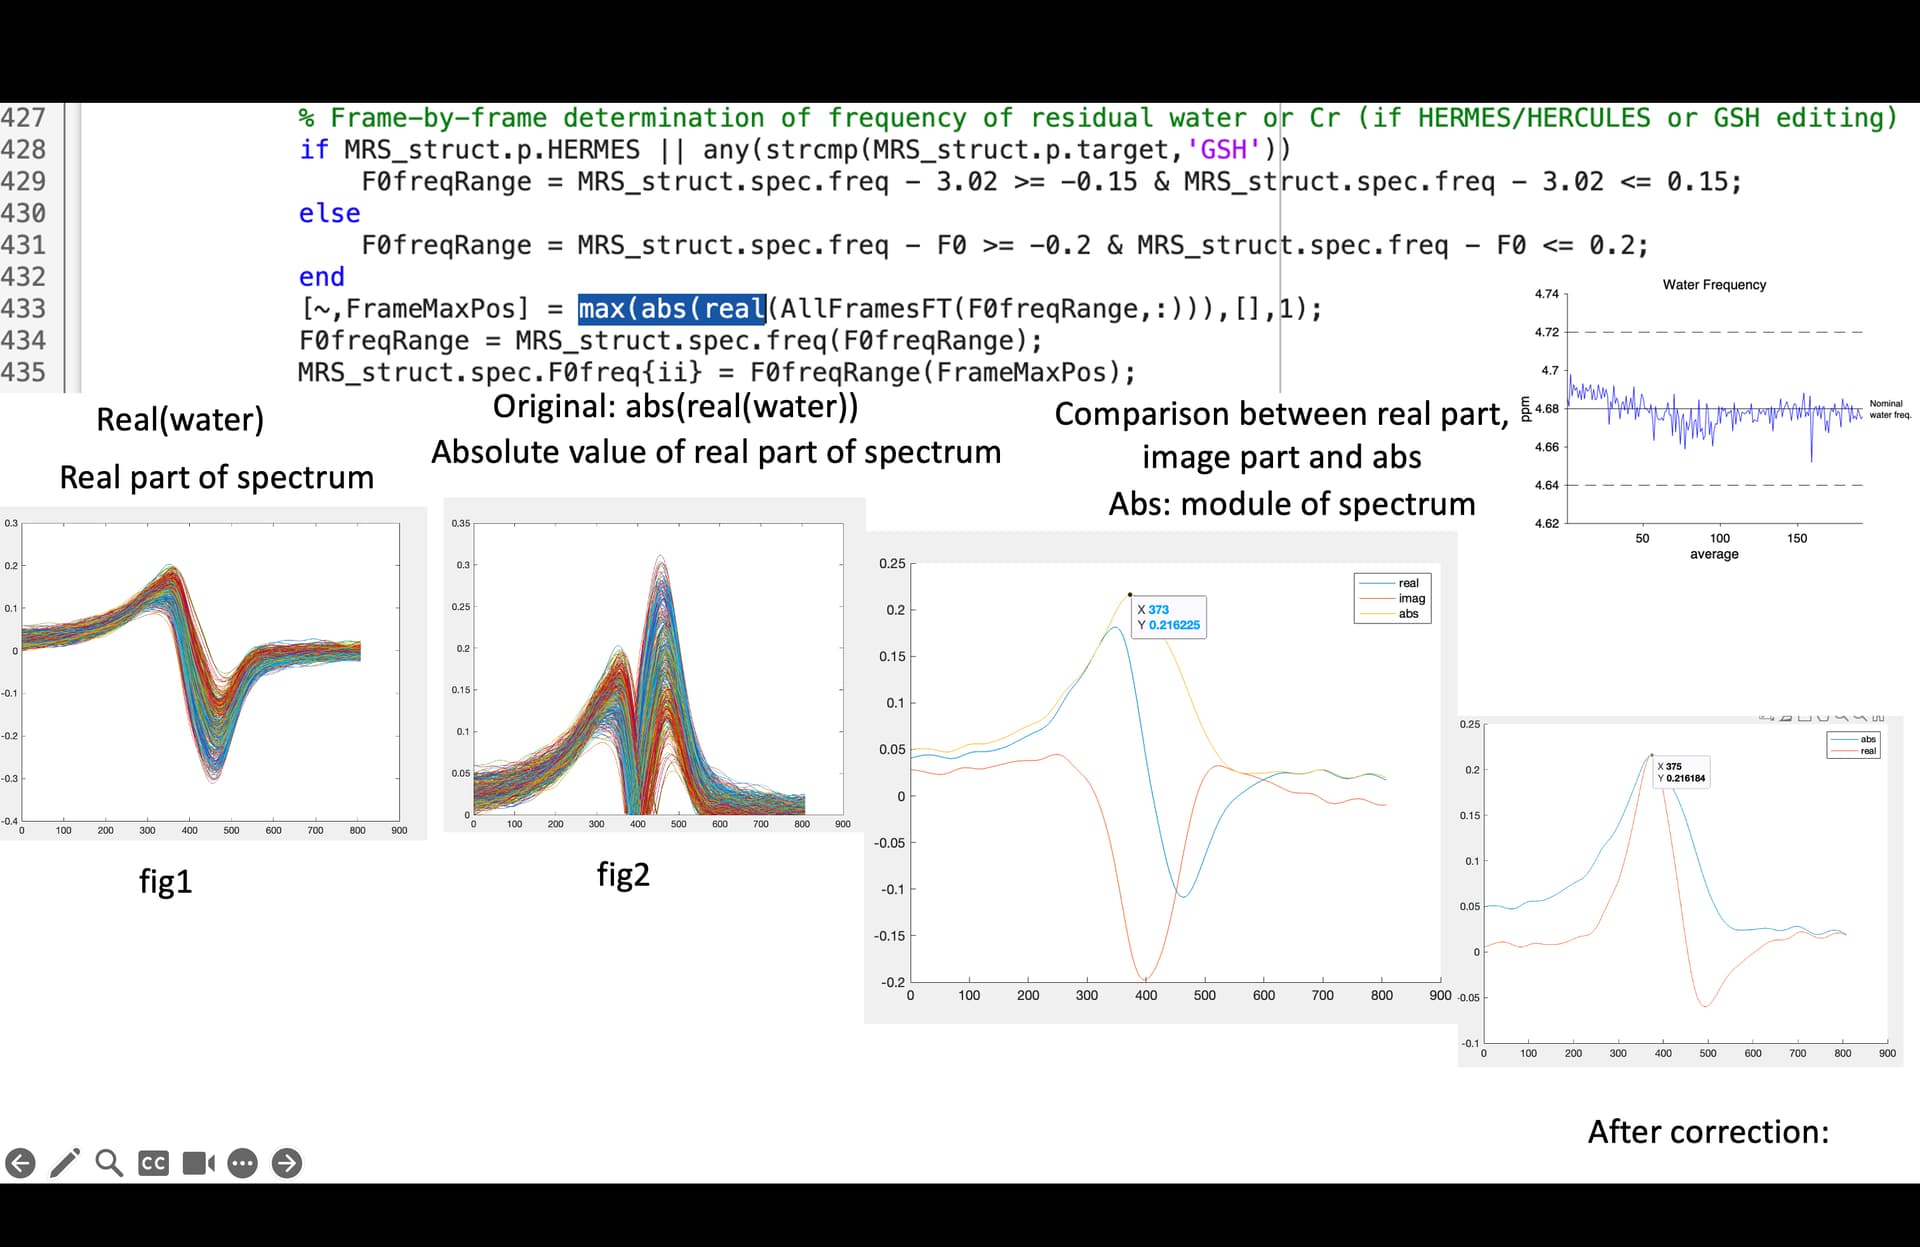
secondly, selecting the real part of this spectrum;
-
thirdly, taking the absolute value of the real part;
-
finally, identifying the positions of the maximum values within each transit based former steps.
These maximum values collectively form the water frequency curve.
-
My inquiry revolves around two key aspects. Firstly, I am unsure about the rationale behind obtaining the real component of the spectrum. Secondly, I am curious about the necessity of utilizing the absolute value.
During my experimentation, I observed that the shape of the real component of the spectrum resembles figure 1, whereas its absolute value produces a graph similar to figure 2. Notably, when pinpointing the position of the maximum value, I encountered potential shifts in position. This shift may arise from the upper or lower parts of the real component spectrum.
-
In my perspective, it seems more logical to utilize the absolute value (or modulus or magnitude) of the water frequency to determine the position of the maximum value. This approach appears more reasonable, particularly after applying corrections, as the positions of the maximum values in both the real component spectrum and the absolute spectrum converge.
Because I not sure the principle behind it, your expertise would help me a lot!
Thank you for your time and consideration. I eagerly anticipate your response.
1 Like
Hi @Jiazhen_Wang,
Thanks for your questions and for using Gannet!
I’ll try to answer each in turn as clearly as possible:
-
We display the (residual—that is, after water suppression) water frequency for each transient before alignment for several reasons. First, it provides critical information about the stability of the main magnetic (B0) field, specifically how much the MR scanner experienced field drift that was a result of gradient hardware duty cycling from previous imaging sequences like diffusion imaging. Second, spikes or sudden shifts in the residual water frequency are helpful indicators of participant motion. Third, it also can show whether very strong water suppression was used, which can be detrimental to the alignment of transients during data processing.
-
We take the real part of the data because Gannet does most of its processing/fitting using the real component; hence, it is logical to use the real data as it most closely aligns with the data being handled. Using the absolute of the real component ensures a positive residual water peak is measured.
-
You make a good case for using the magnitude instead of the real component. The reasoning for using the real component is historical. In the past, the data that Gannet has processed, by and large, were not acquired using very strong water suppression, where there would be minimal meaningful differences in the real and magnitude residual water signal frequency. In your example, the lineshape of the residual water signal indicates that either strong water suppression was used or perhaps some pre-phasing is needed on the data. This is not an issue if the B0 field is stable and there is minimal head motion. It becomes problematic if there is instability.
One last thing to point out is that displaying the residual water frequency on a by-transient basis usually is for qualitative analysis. So it can be argued that how the frequency is measured is irrelevant. That said, Gannet does provide a quantitative measurement of frequency offset (AvgDeltaF0 in GannetLoad.m). However, this is a relative estimate of offset, so how frequency offset is measured might not be that important.
I hope this helps. Do reach out if it does not.
Mark
Thank you for your response! Building upon your answer, I have some additional questions.
- Evaluating Data Stability:
I am inquiring about methods to assess the stability of my data. As you mentioned, the water frequency can serve as an indicator of the B0 field’s stability. However, due to the strong water suppression in my data, there has been a noticeable alteration in its shape. Consequently, the water frequency may not reflect the stability.
- Exploring the Use of Magnitude Instead of Absolute Real Components:
Given the aforementioned situation, I am contemplating whether it would be viable to use the magnitude of the data as an alternative to the absolute value of the real components. This approach could potentially offer a more coherent depiction of the maximum value’s position while accounting for the influence of water suppression.
- Investigating Potential Concerns in Pre-Phasing Steps:
Furthermore, I am investigating the potential challenges that may arise from the pre-phasing steps. Could there be underlying issues of which I should be aware(As you mentioned that the shape may be caused of the wrong pre-phasing)? If such concerns exist, I am curious to know how adjustments to the pre-phasing procedure could address them.
I am eager to hear your insights on these matters. Your expertise would greatly assist me in navigating these complexities.
Hi @Jiazhen_Wang,
Could you please provide the GannetLoad and GannetFit PDF output of one of your datasets (e.g., the dataset you shared in your original post)? This will help me better give answers to your queries.
Mark
OK!
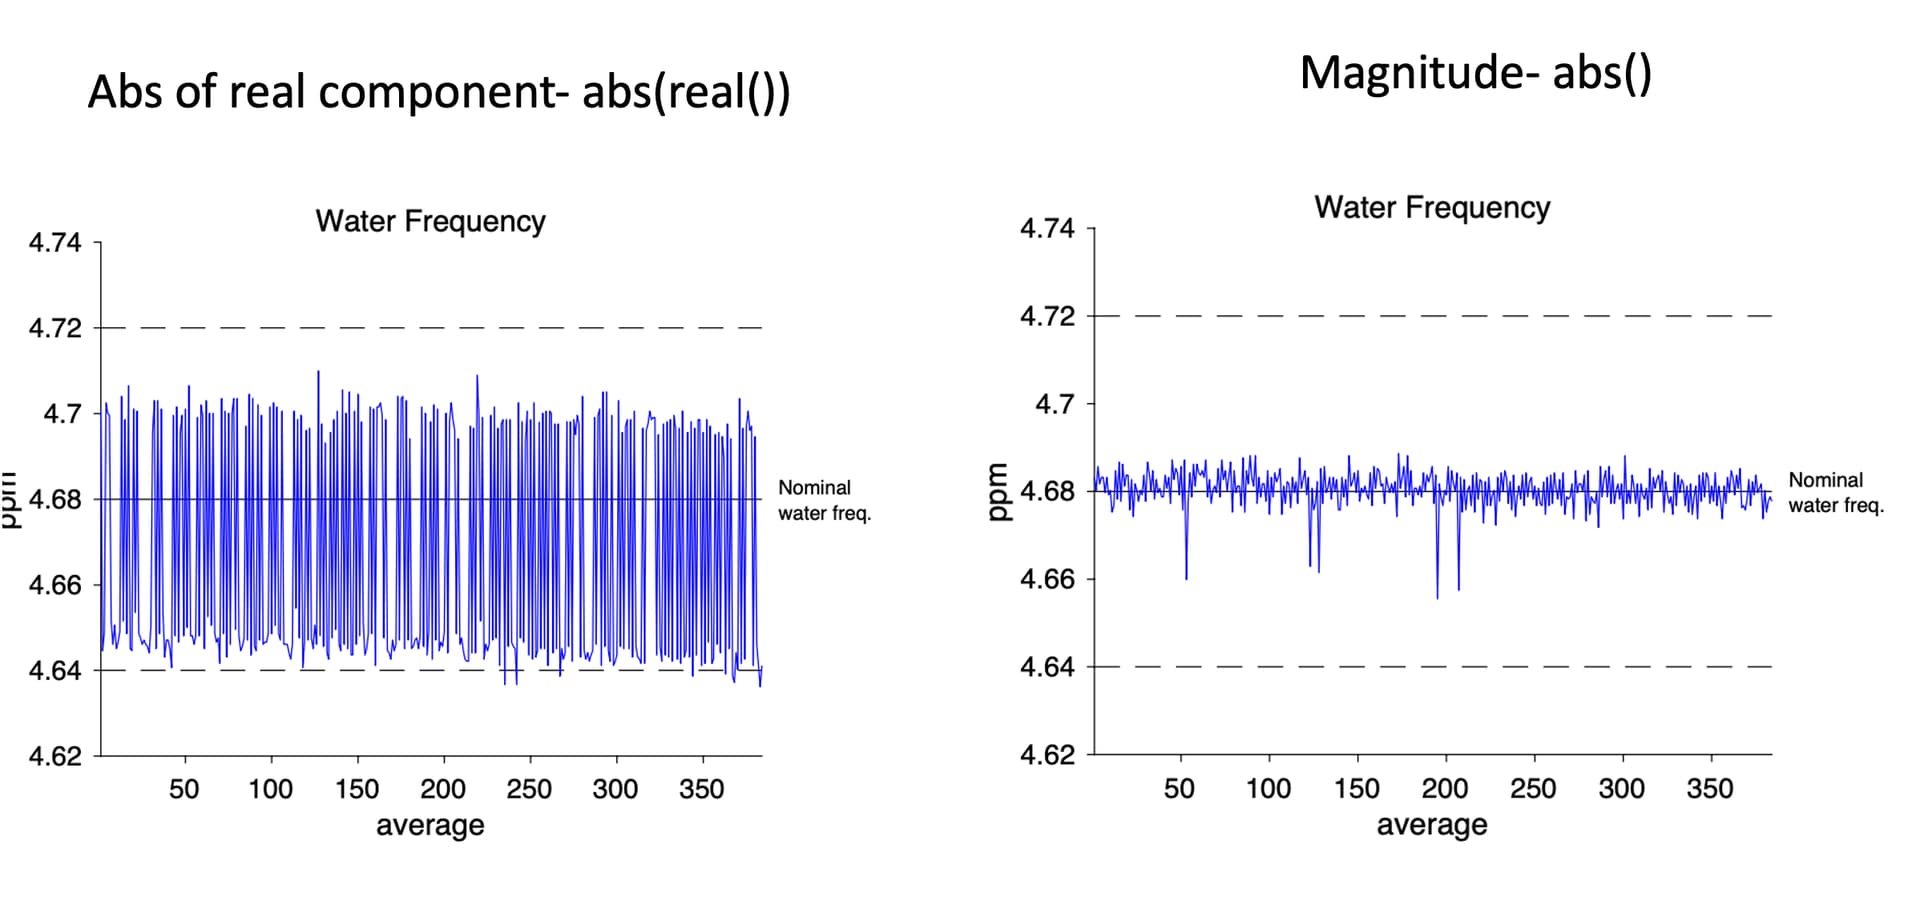
The first picture shows different water frequency using magnitude and absolute of real components.
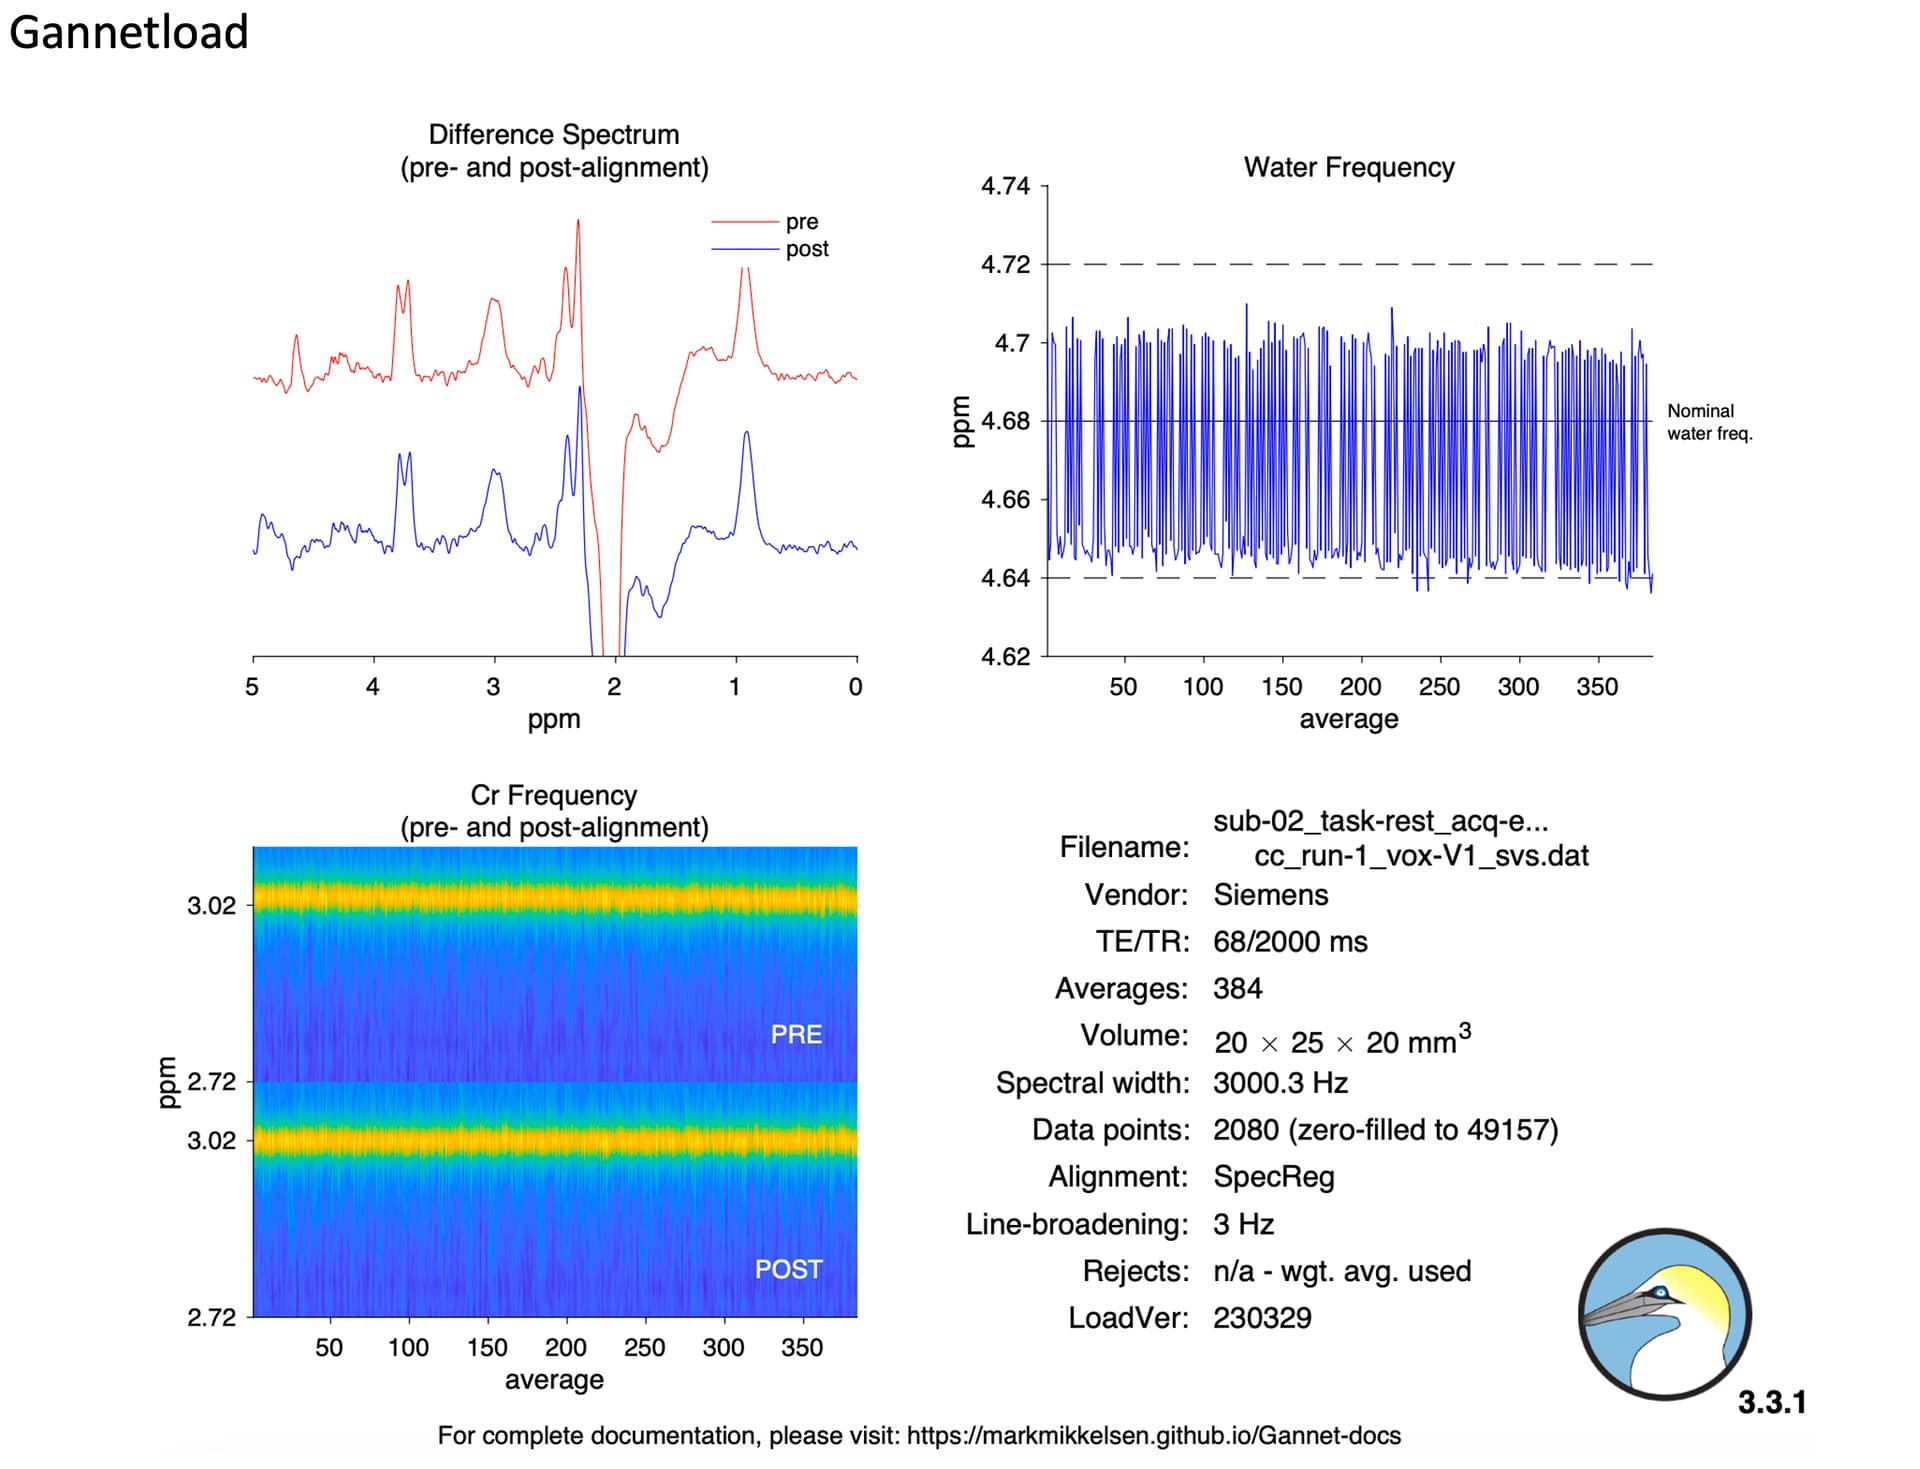
The second picture is Gannetload output.
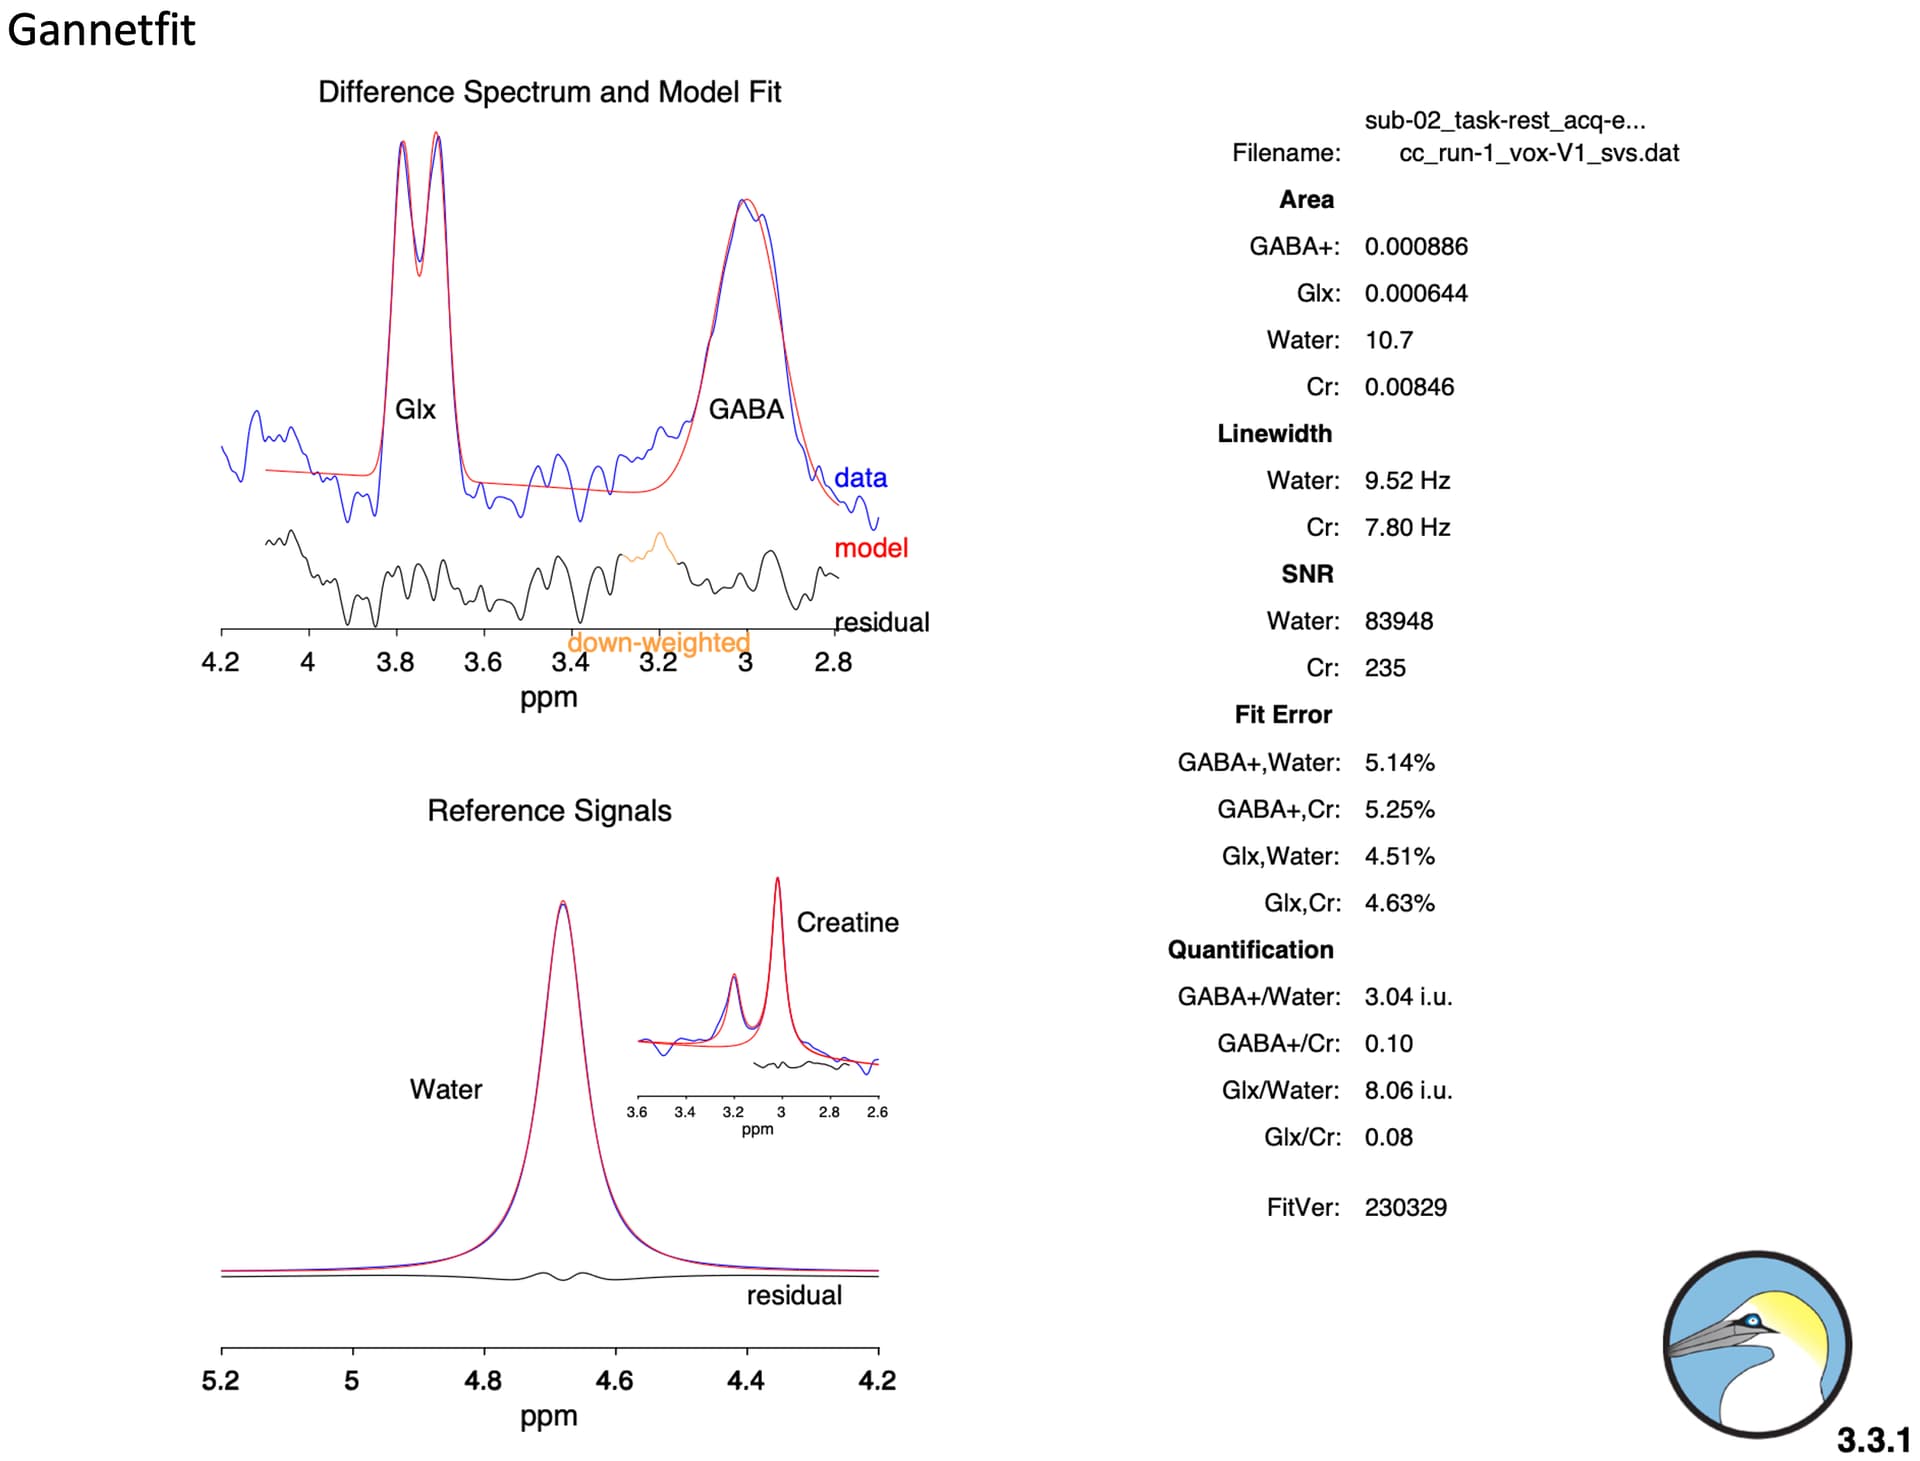
The third one is GannetFit output.
As the pictures show, I use the 384 transits because I want to measure the CV using different transits.
Thank you!
1 Like
Your data are of high quality. It looks like using the magnitude does indeed provide a better representation of the water frequency when strong water suppression is used (as in your case). Thanks for sharing this; I might amend the calculation in the next version of Gannet.
Thank you for your reply, looking forward to your update!