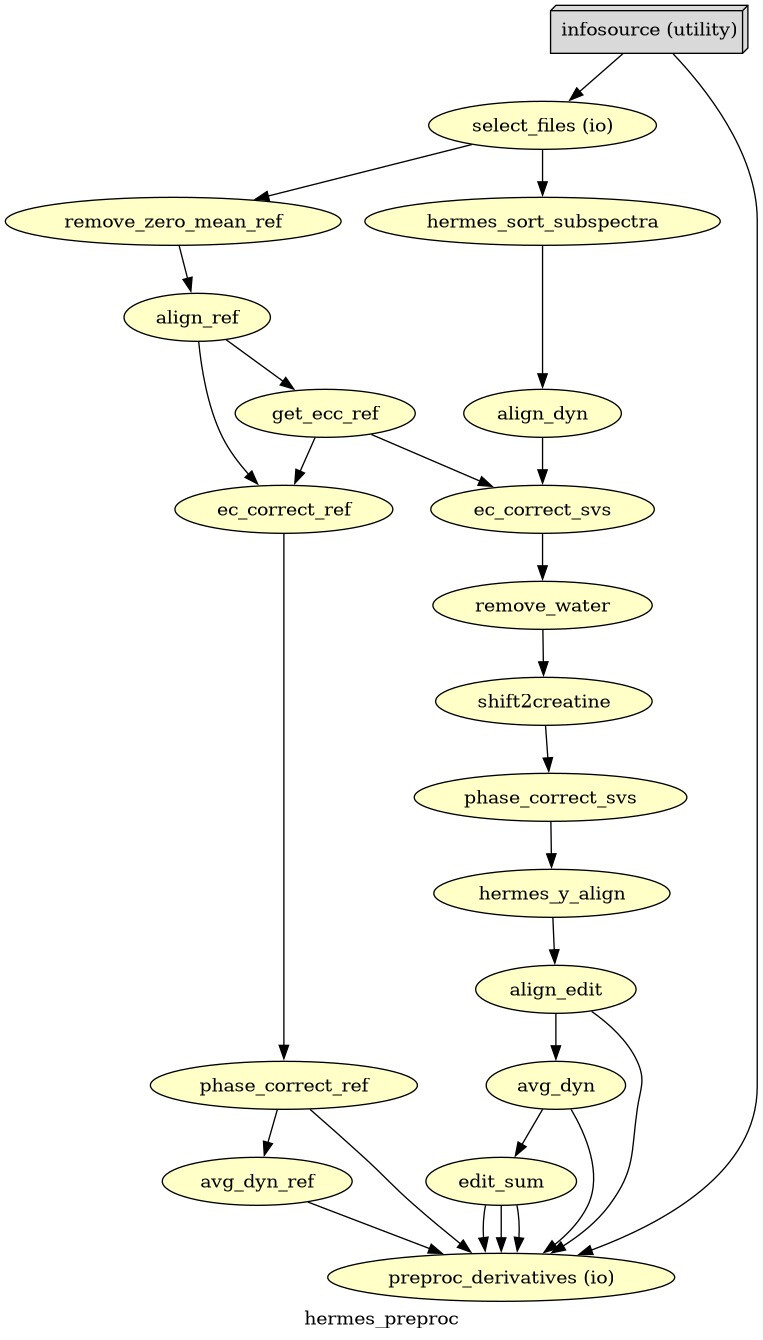
Hello everyone. We acquired some HERMES data in both the ACC and the PCC. I preprocessed them with fsl_mrs. I would like to get some feedback on the quality of the data, particularly about the GABA and GSH peaks.
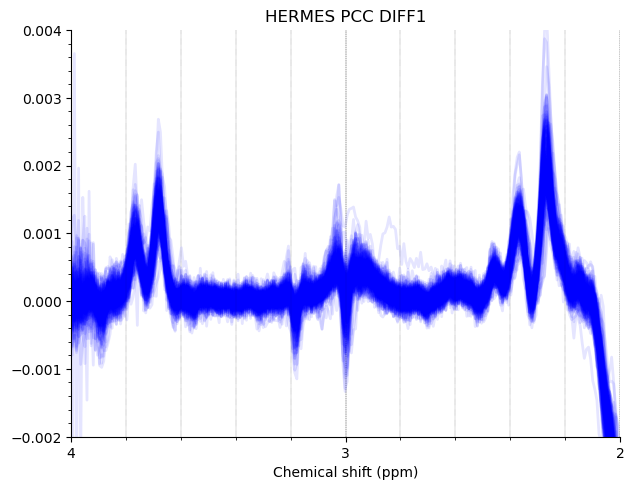
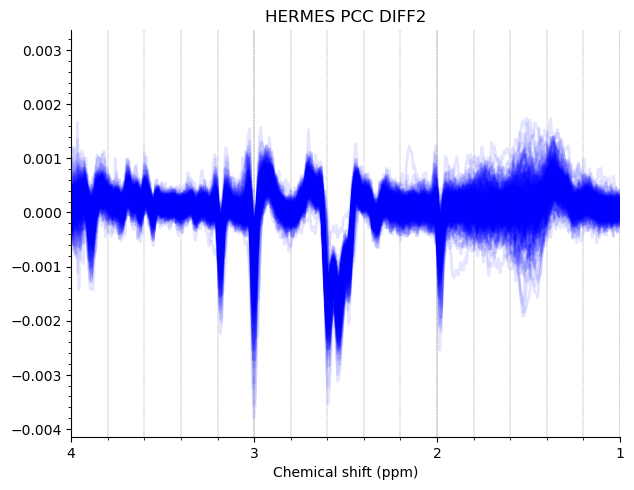
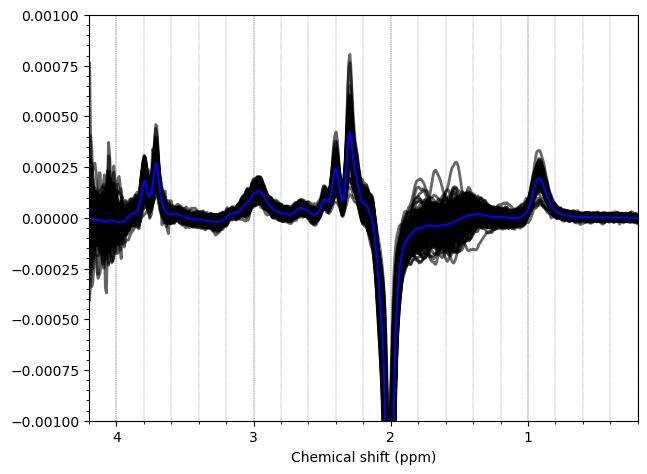
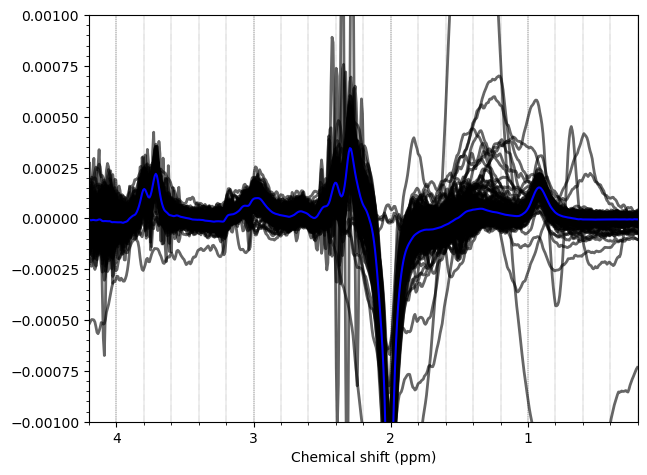
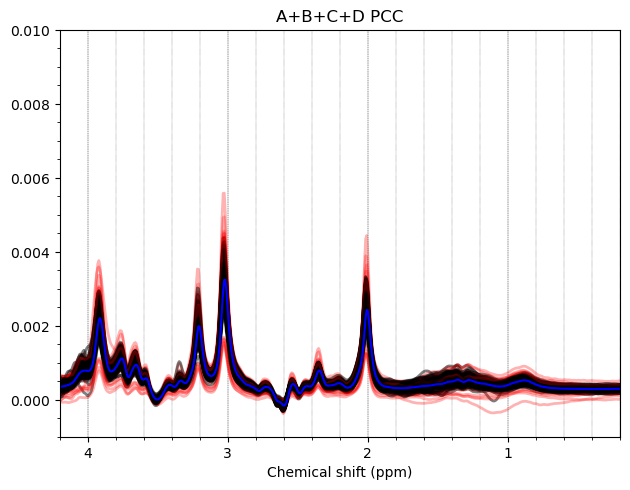
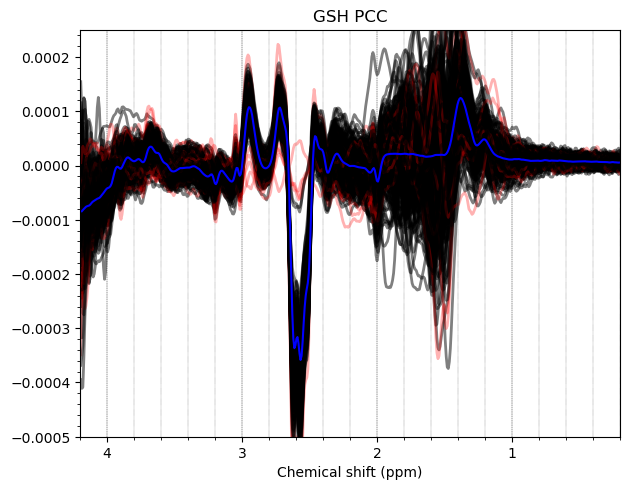
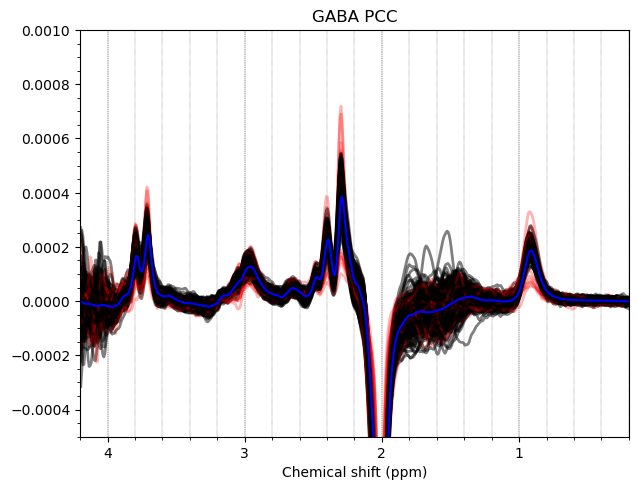
Most of the PCC data looks ok. Here are the summed/subtracted spectra of all our participants (apodized for visualization). Red spectra are 1.9 standard deviations from the mean, blue is the mean spectrum.
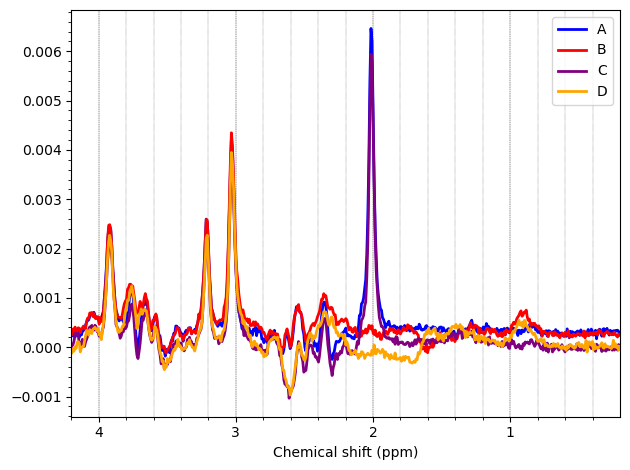
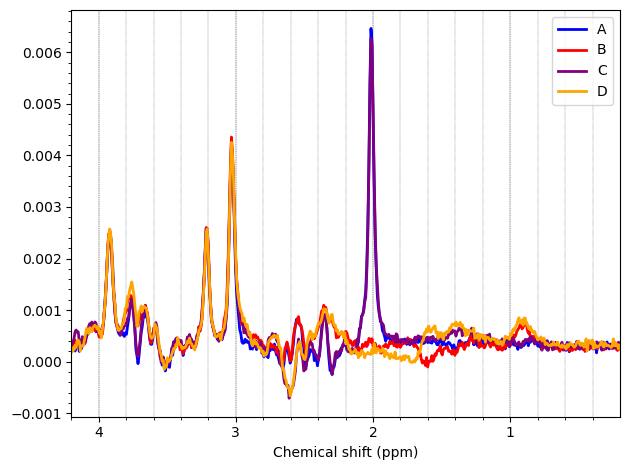
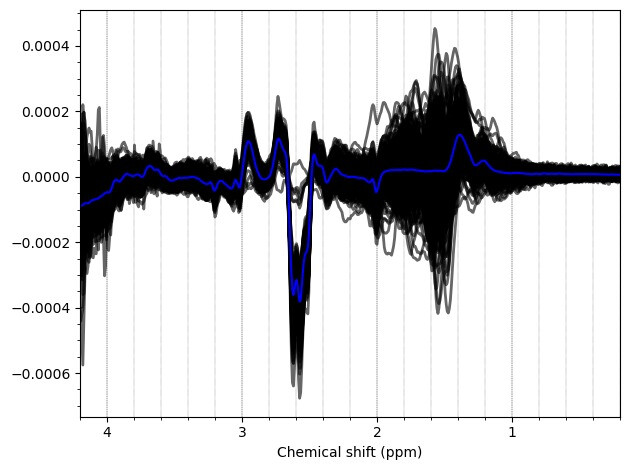
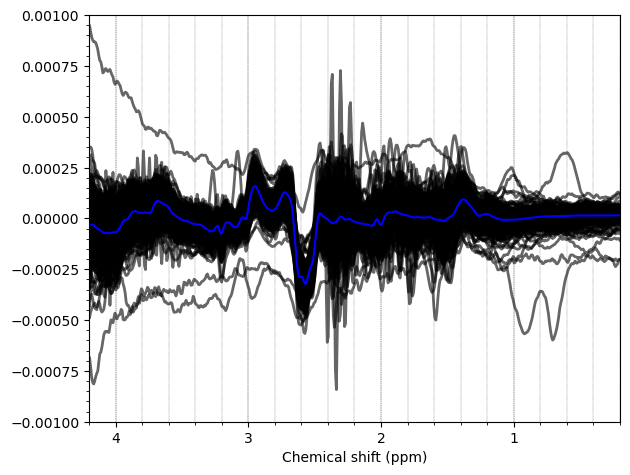
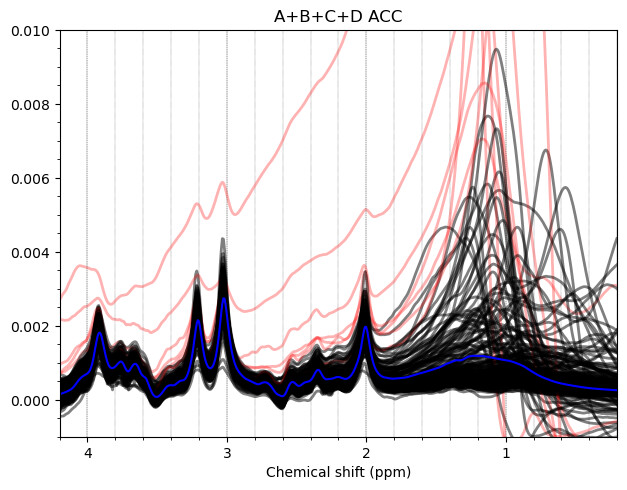
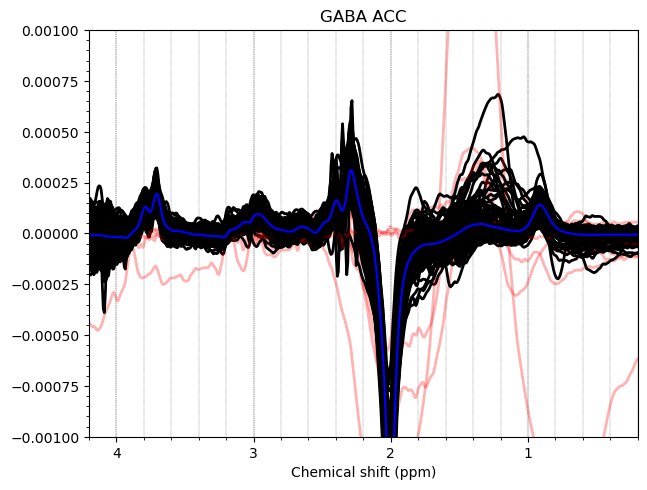
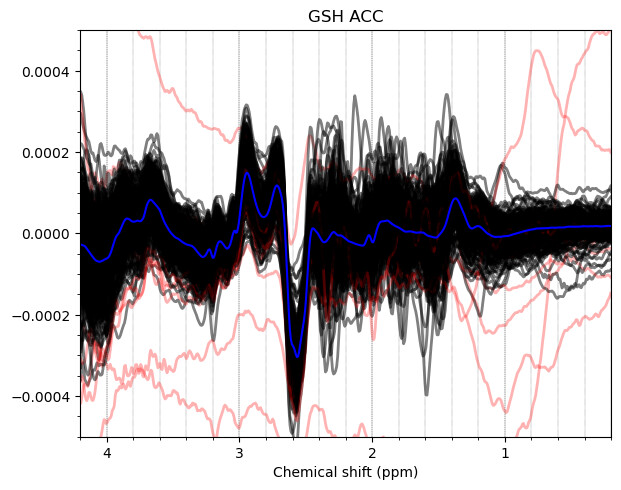
And these are the ACC data, which look more problematic. Particularly concerning is the lipid contamination seen on the ‘A+B+C+D’ spectra, should i exclude those if my goal is to measure GABA and GSH?
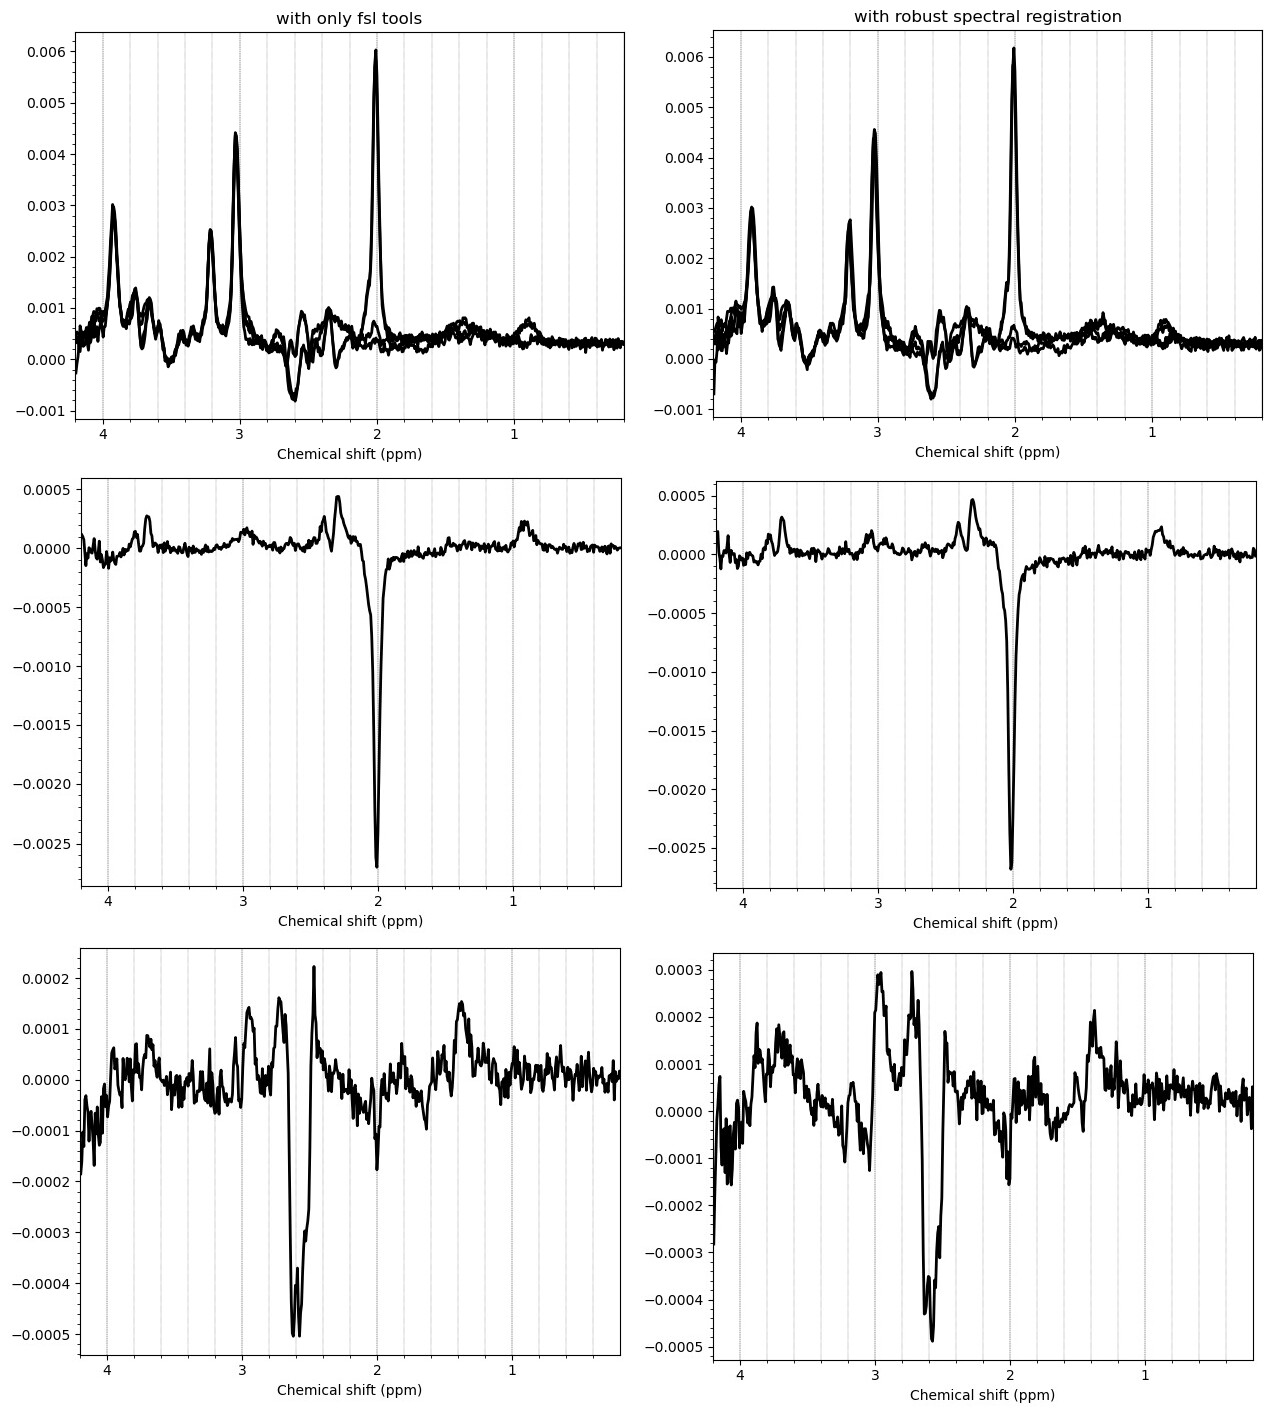
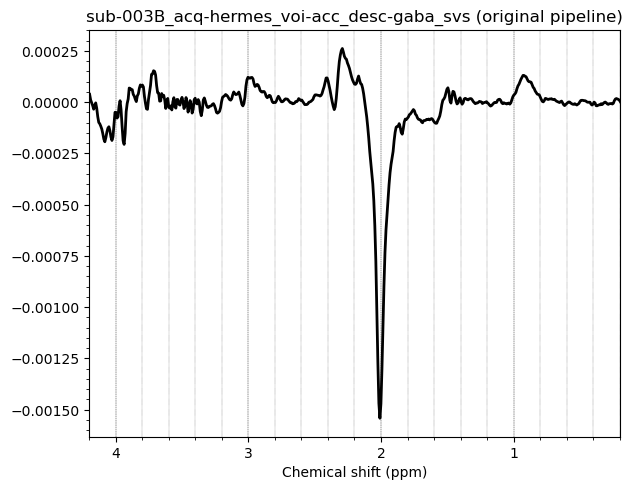
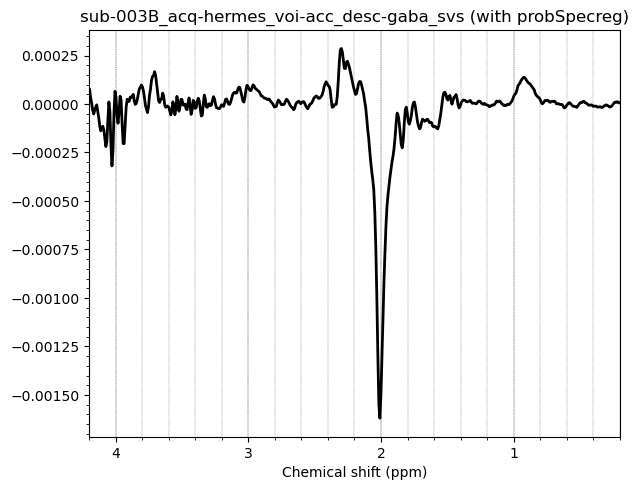
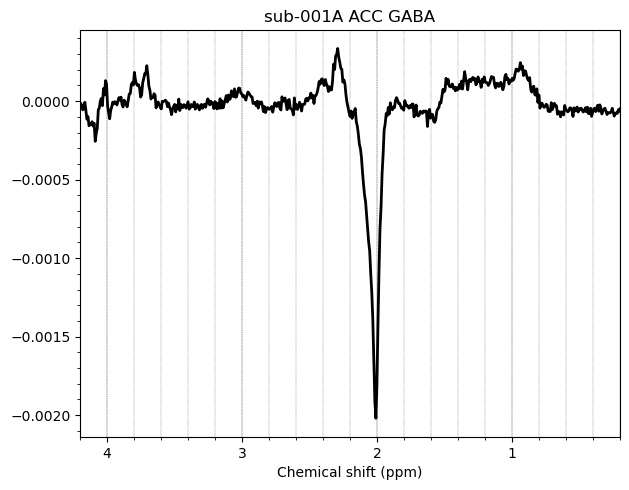
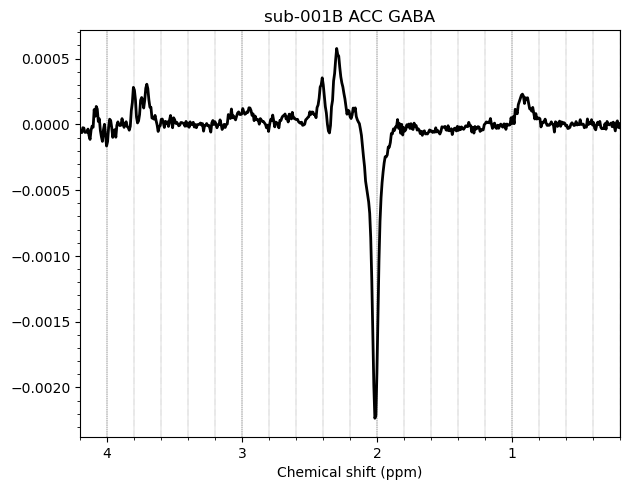
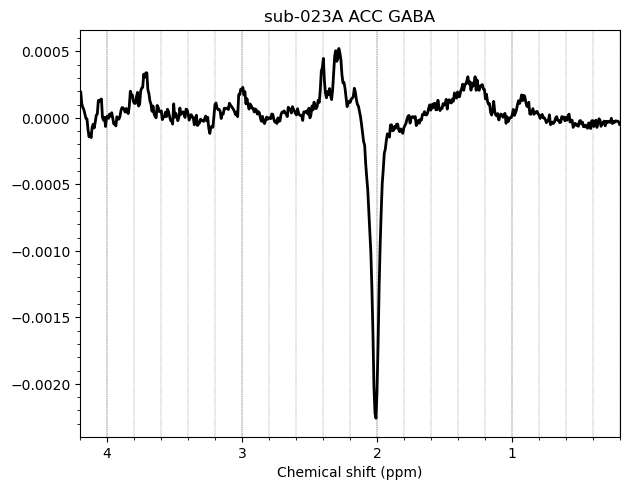
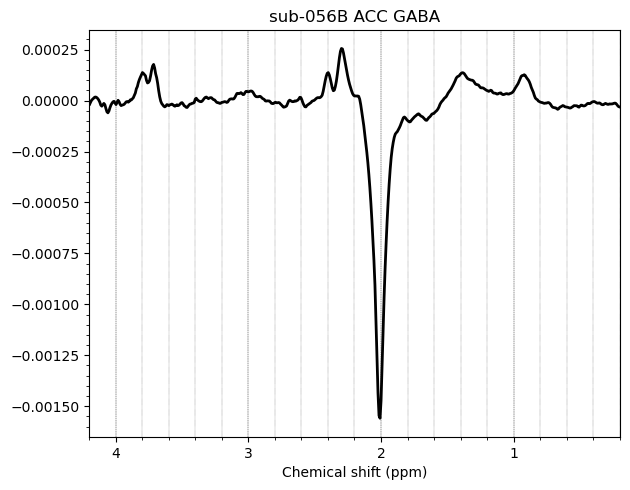
I want to show you some examples of some individual GABA spectra and see if you agree with my judgment. These are not apodized.
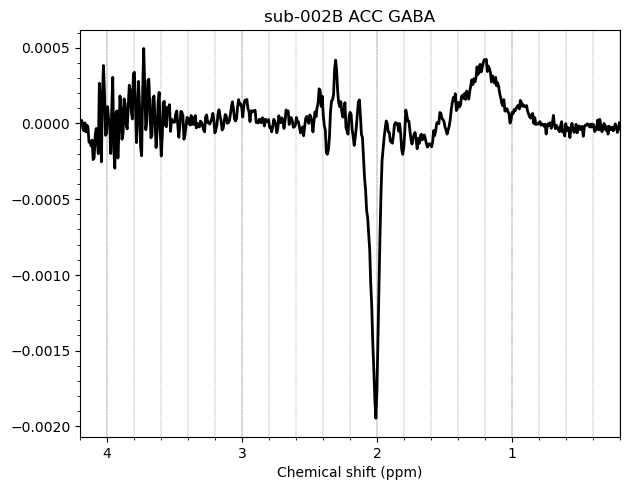
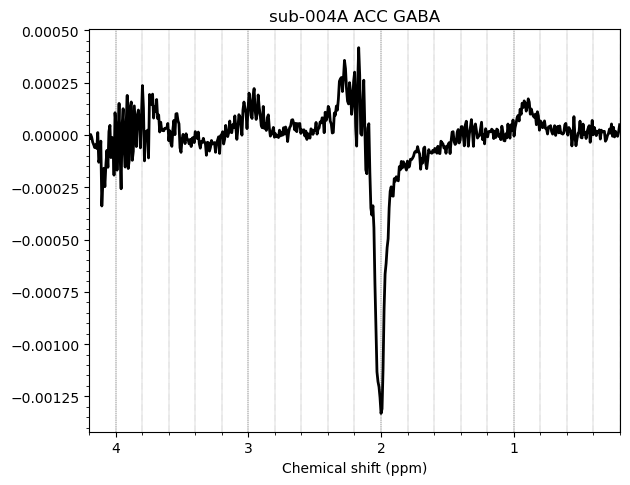
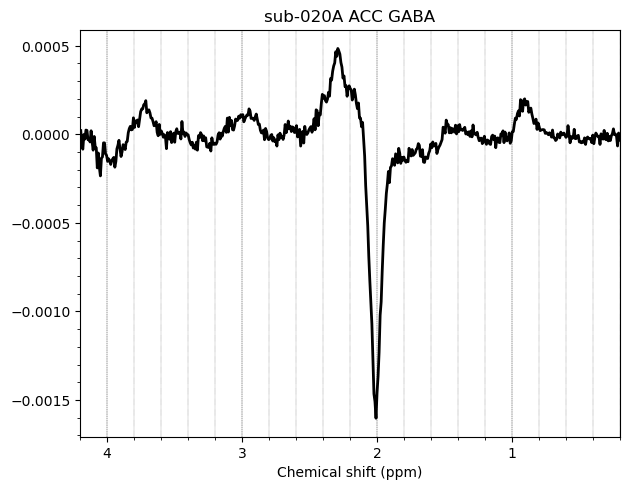
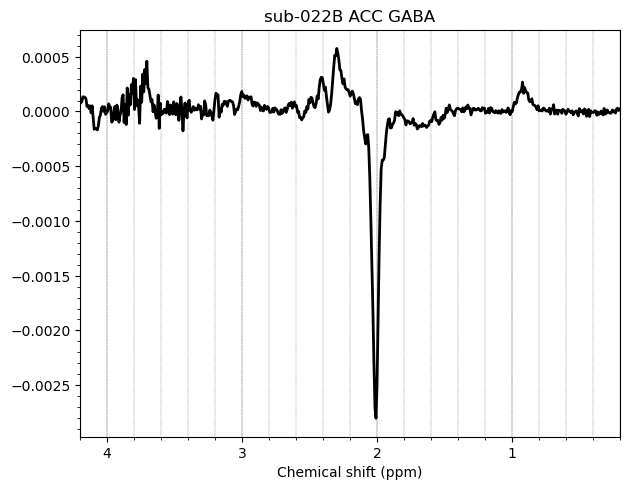
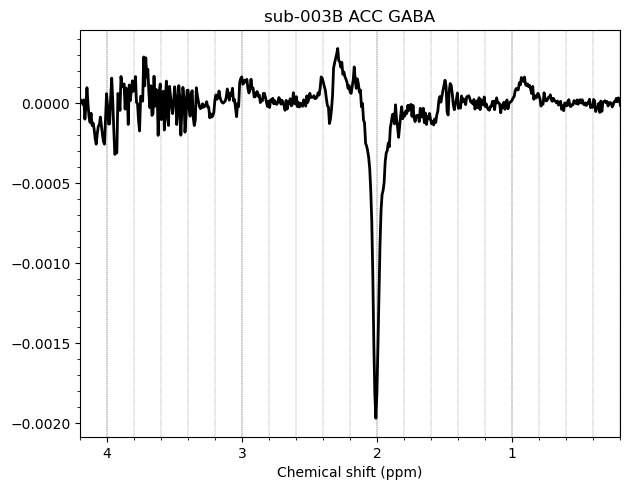
Here are some examples which i think look fine
Here are some examples i think i should exclude judging by the glx region on the left and the low SNR.
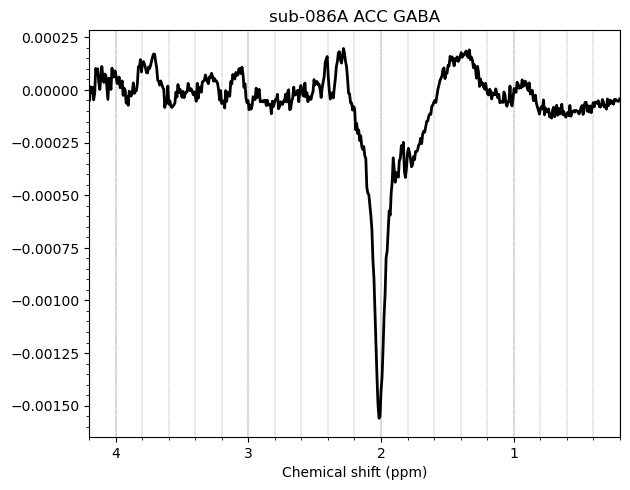
Here is an example i think i should exclude based on the linewidth
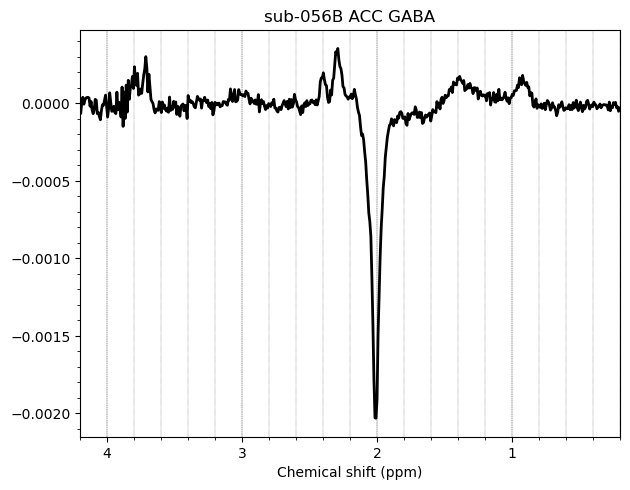
And here are some examples i think i should exclude due to subtraction artifacts
There are also some examples where the GABA peak is barely visible without apodization, and i am not sure what to make of these
Sorry of these are too many examples! I would appreciate any feedback.
Diego