I’m always unsure of how to deal with lipid contamination in the post acquisition phase, thus I’m posting some pics here to ask for expert advice (I’ve found at least two other posts with similar spectra but the replies were mixed).
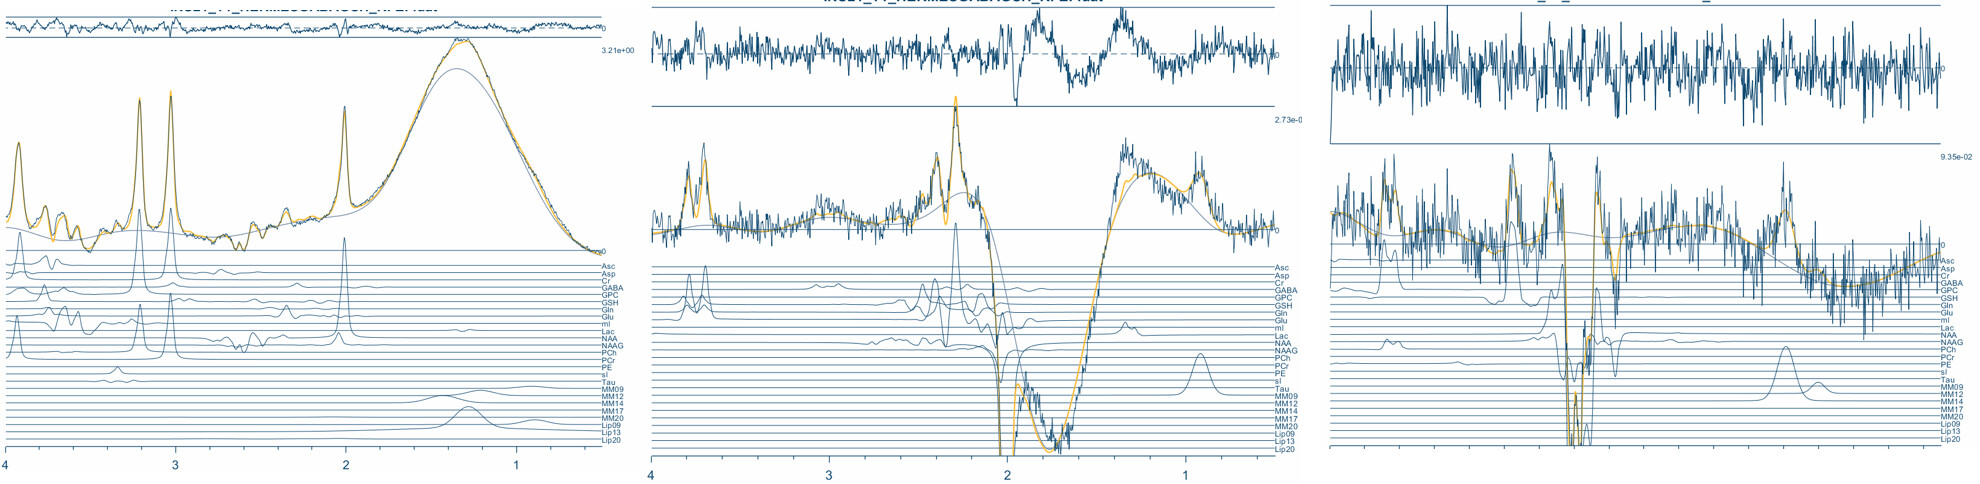
We have frontal eye field spectra and there’s lipid contamination in a few participants. In the first case, the big lump is evident in the sum and diff1 spectra, but not in the diff2. My questions are:
should I exclude this dataset?
2 or, can I use the diff2 GSH values and even the sum Glx and tCr values?
would cutting the ppm around 1.8 be a solution (not sure using datasets with different ppm ranges is ok)?
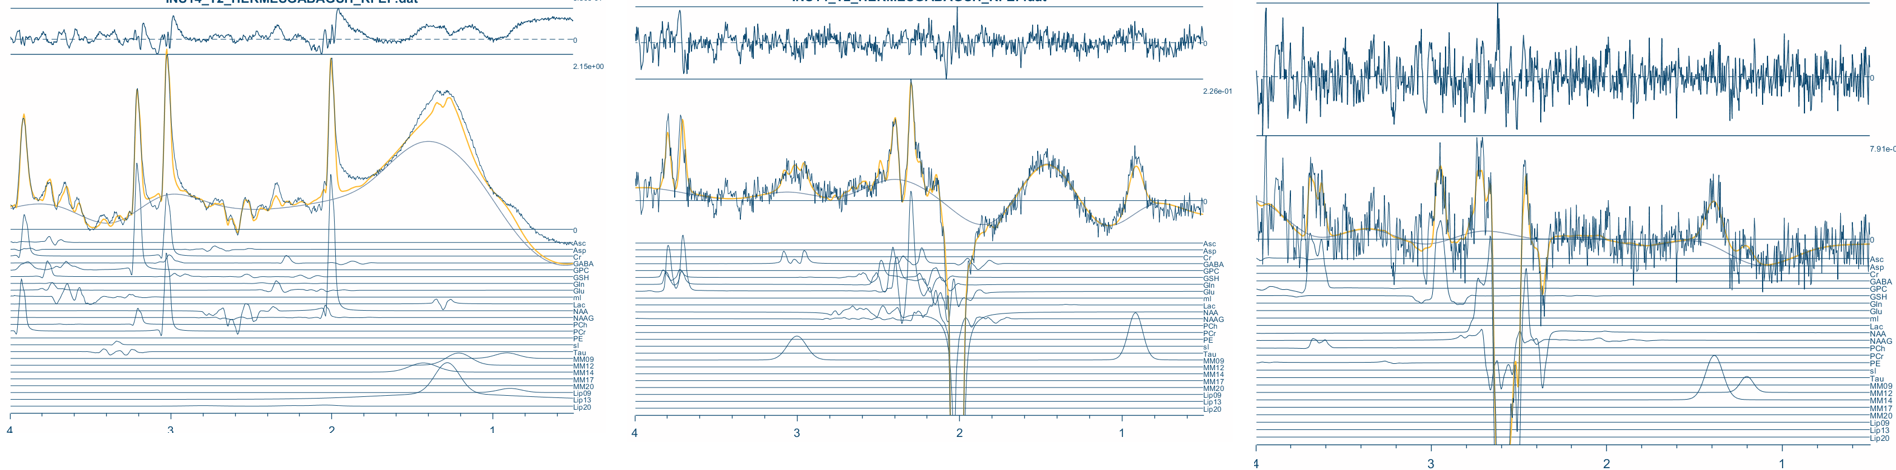
In the second case, the lipid contamination is still considerable, but it doesn’t seem to greatly affect the diff1 and 2 (or the sum that much either?). My questions are similar:
I’m afraid there’s not really very firm guidance on dealing with lipid contamination. My personal rule of thumb (which is in no way evidence-based) is to become wary of the maximum of the lipid amplitude exceeding more than 50% of the maximum NAA amplitude.
In both of these cases, the model appears to cope with the lipids relatively gracefully in the sum spectrum (a bit better in terms of phasing for the first one, despite the lipid being larger).
As you say, the GABA-edited difference spectra still look relatively reasonable (particularly the second one), since the baseline captures most of the lipid contamination.
Rather than reducing the overall fit range (which would mean losing the very useful 0.9-ppm MM anchor that we use to help estimate the co-edited MM in the GABA spectrum), Osprey allows you to specify ‘fitting gaps’, i.e. regions that are excluded from the least-squares calculation during the fitting. If you look into the example MEGA job file, you can see that this is specified similar to the fit range with parameters for the gap in the edit-OFF (internal Osprey name A) and GABA difference spectra (diff1) called
opts.fit.GAP.A              = [];
opts.fit.GAP.diff1          = [];
Now, for HERMES data, I’m a little unsure whether the gap is already supported for sum and diff2 (GSH difference spectra) (@Helge will know for sure); you’d analogously specify something like the following - I’m using 1.1 to 1.9 ppm to exclude the lipid-affected area, but @Chris_Davies-Jenkins might have some more precise values in mind since he just worked on that for a paper revision:
Since the GSH difference spectra look just fine (they are not touched by the GSH editing pulses), it’s probably alright to not specify a gap for them at all.
In general, it’s probably also a good idea to check whether your GABA+ and GSH estimates in lipid-contaminated spectra are systematically different than in non-lipid-contaminated spectra. It’s difficult to predict because lipids themselves are a bit unpredictable in terms of their frequency and phase, and therefore almost impossible to impose a hard rule.
Apologies, I typed out a response but apparently didn’t click send…
For the paper revision that Georg mentioned, we used the following gap parameter for the difference spectrum:
opts.fit.GAP.diff1 = [1.2 1.9];
This particular gap worked well when we looked at lipid-contaminated GABA-edited data. It allowed the model to avoid the worst of the lipid signal, without affecting the modeling of NAA to the left, or of the MM09 signal to the right (a useful anchor for reliably fitting GABA+).