Dear community
I am trying to do SVS and want to kindly ask for availability of macromolecules basis set (.json or .raw)
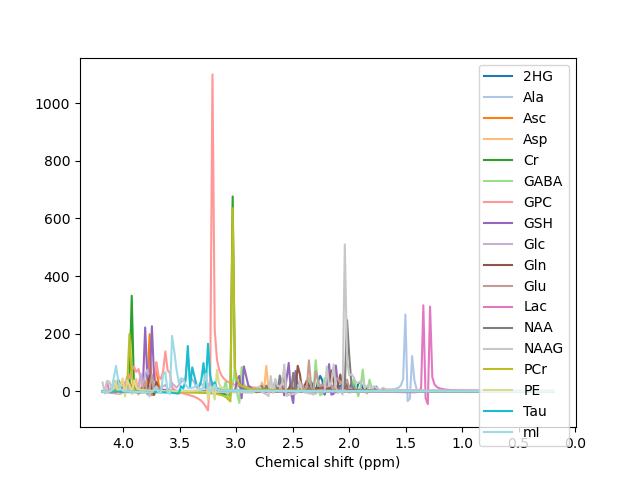
I used the following source to get basis sets for metabolites https://juchem.bme.columbia.edu/content/mr-spectroscopy-basis-sets
however, here there are no sets for macromolecules.
Please see the images (basis and report’s screenshot) and pdf report attached:
Thanks in advance
Ok thanks for checking. The other thing that could be wrong is your data bandwidth. How did you convert your data? Do you have the protocol from the scanner?
Thanks dear @wclarke for your reply
I converted the data using the following command from the practical (using my own directory)
spec2nii twix -e image -f steam_metab_raw -o data meas_MID310_STEAM_metab_FID115673.dat
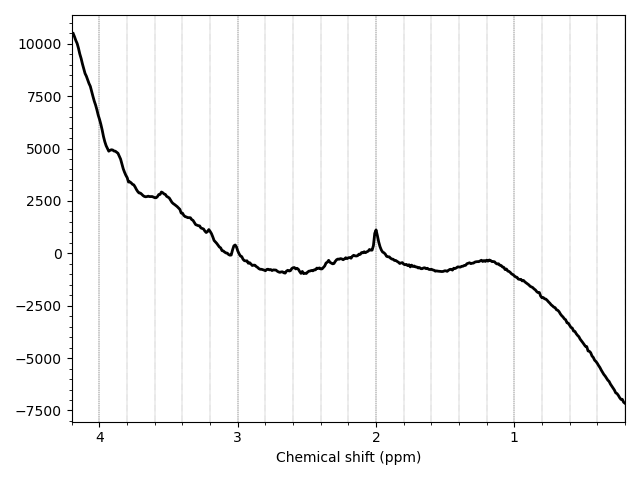
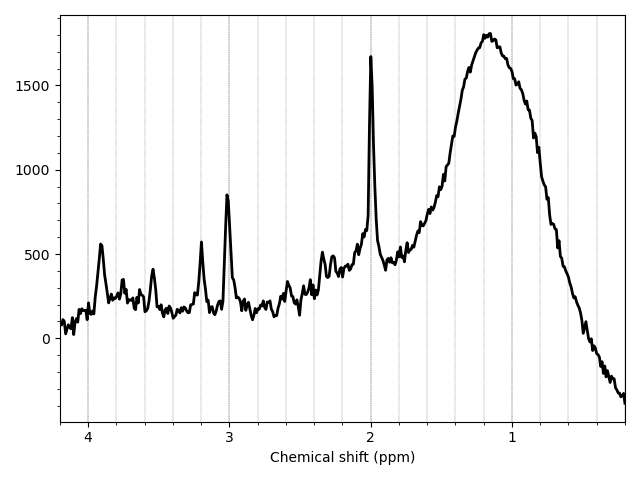
Please see the attached images of visualizations of both files (water suppressed/ not suppressed)
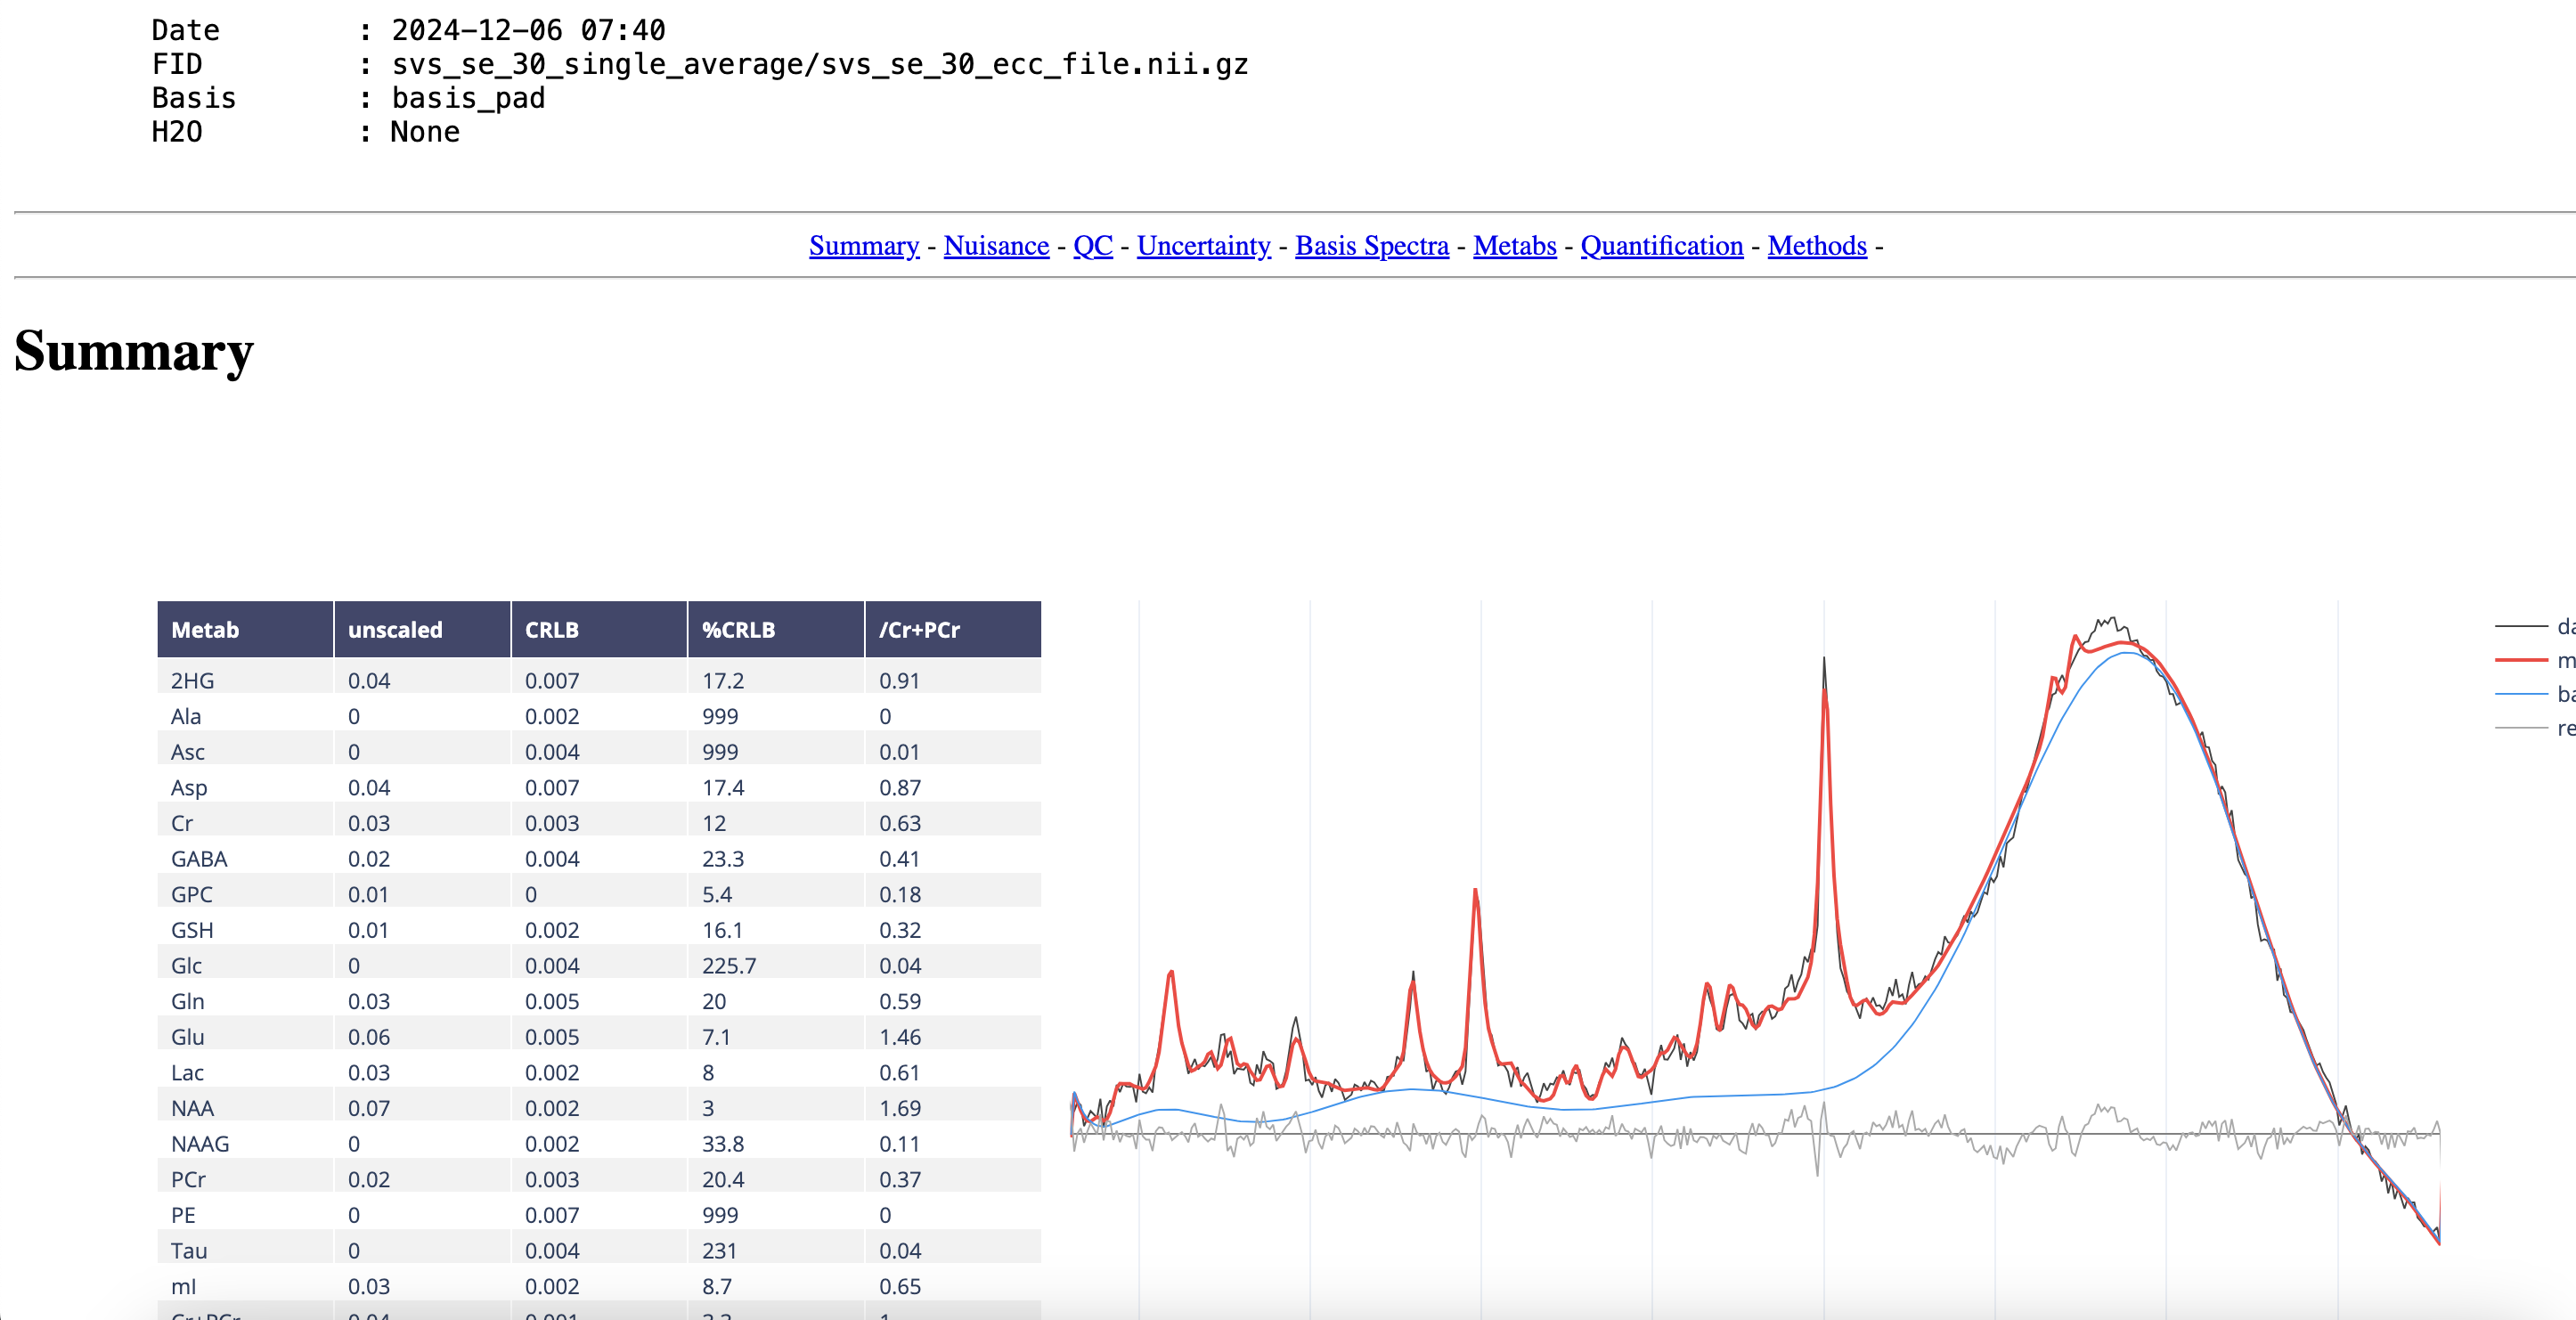
Another thing I wanted to ask is that in my report I see that my basis is shifted towards left, instead of being from 0-4.5ppm range its in 3.5-4.5ppm range
I suspect this being the reason of poor fitting on the right side. Please see the image attached.
The data you’ve tried to use for fitting (./fsl_mrs_proc/metab.nii.gz) is from a 7T scanner. Is this the example data? Your own data (I presume zip/svs_se_30_single_average/svs_se_30_ecc_file.nii.gz), measured at 2.89T does fit.
I had to do two things to make it work. 1) pad the basis set with zeros as the number of time points it covers is very short, and 2) set the baseline_order fit setting to 12 (which is high), to cope with the large artifactual lipid peak on the right of the spectrum.
Is this artefact something you see in lots of your data?
I padded the basis by doing the following
from fsl_mrs.utils import mrs_io
import numpy as np

basis = mrs_io.read_basis('basis')
basis._raw_fids = np.pad(basis.original_basis_array,((0, 2048), (0,0)))
basis.save('basis_pad')
This isn’t ideal as it leaves a small step in the time domain, causing ripple in the spectral domain.
Dear @wclarke
I have changed my metab.nii.gz accordingly no its spectrometer frequency is 123,.238832 MHz and Field strength is 2.89T
however, when I try to do the fitting, I see this error
The basis spectra covers too little time. Please reduce the dwelltime, number of points or pad this basis.
I tried to implement your code for padding but it did not worked on command line
can you please, indicate how can I do padding a solve this issue
Thanks
Dear @wclarke
Thank you for your guidance, however I was not able to implement the padding due to not being able to install fsl-mrs numpy. I tried both on my default windows cmd and WSL linux, however for both of them I got the same error.