I analysed my data in both Osprey and JMRUI. However, the results don’t agree and are quite different. I was wondering if anyone else had the same issue? Any advise/suggestions will be very much appreciated.
Another unusual thing I’ve encountered, we had 3 corrupted files in our raw data (2 files for the actual data and one for the reference file). We couldn’t open those in JMRUI, however Osprey was fine.
Welcome to the MRSHub, I’m glad you found your way here. I can give a relatively generic answer as to why results don’t agree below - to find out more specifically what we can do in your case, I’ll ask for a bit more information about your data and your analysis.
Generally, there are obviously a lot of software packages and algorithms to analyze MRS data out there. Unfortunately, they all have different ways and degrees of pre-processing, they employ very different algorithms to model the data, and they very notably differ in the way that they perform water-scaled quantification, i.e. accounting for relaxation, tissue composition effects, etc. All these differences, if not accounted and strictly controlled for during your analysis process, are likely to have a systematic “effect of tool” on your results.
So, even as an expert I would never expect numbers you get from two different softwares to agree well. However, let’s get to the bottom of your particular project:
What kind of data are you analyzing? Which system, which sequence, and which data format?
Which jMRUI algorithm are you using, and what are your processing steps?
Can you share screenshots exemplifying your data, the modeling results, and a more detailed description to what extent the results differ?
Can you provide screenshots of the error message that occurred when you were trying to open the data in jMRUI, and how they looked in Osprey?
I fully agree with Georg. In case you used QUEST from jMRUI you could also ask Jana for some help.
Jana and Zenon are now developing jMRUI and they can be of help. I also know that the selection of the no of point used to model the macromolecules (in QUEST might be called background) has a huge impact on the results . This is you did not use an in vivo measured macromolecules signal in your basis set.
best
cristina
Thank you so very much for your replies. I did suspect that the answer might be the differences in how the data is treated in various packages. JMRUI for example has a few manual steps which I am sure had an effect and each participant needs to be pre-processed individually whereas Osprey allows a batch option.
In terms of our project, the data was collected in functional MRS study. One of the aims was to investigate the effect of echo time on the signal. We used PRESS sequence on Philips scanner, TR = 1s; TE = 35ms; TE = 80ms; TE = 140ms; number of acquisitions per block = 720; files in SDAT format. I only analysed TE =35ms with Osprey as other TEs are not currently available in Osprey.
We performed two types of analysis, one as a functional MRS in JMRUI (averaged spectra for each time point of the trial (80 trials)), and another as a static analysis (averaged across the whole block (720 acquisitions in one block)). I repeated static analysis in Osprey and tried to compare the results between these two packages.
All processing steps in JMRUI had to be done separately for each subject and include removal of first 9 acquisitions (leaving 711 acquisitions), alignment, averaging across acquisitions, removal of residual water signal with HLSVD filter (manual step), phase correction with reference file, set reference to NAA, quantitation with QuasarX. Model fit in QuasarX is also a manual step.
Of note, our JMRUI basis set contains smaller number of metabolites than the set in Osprey. I wonder if that could have affected the results.
In terms of Osprey, I went with default options. Perhaps this is were I went wrong!
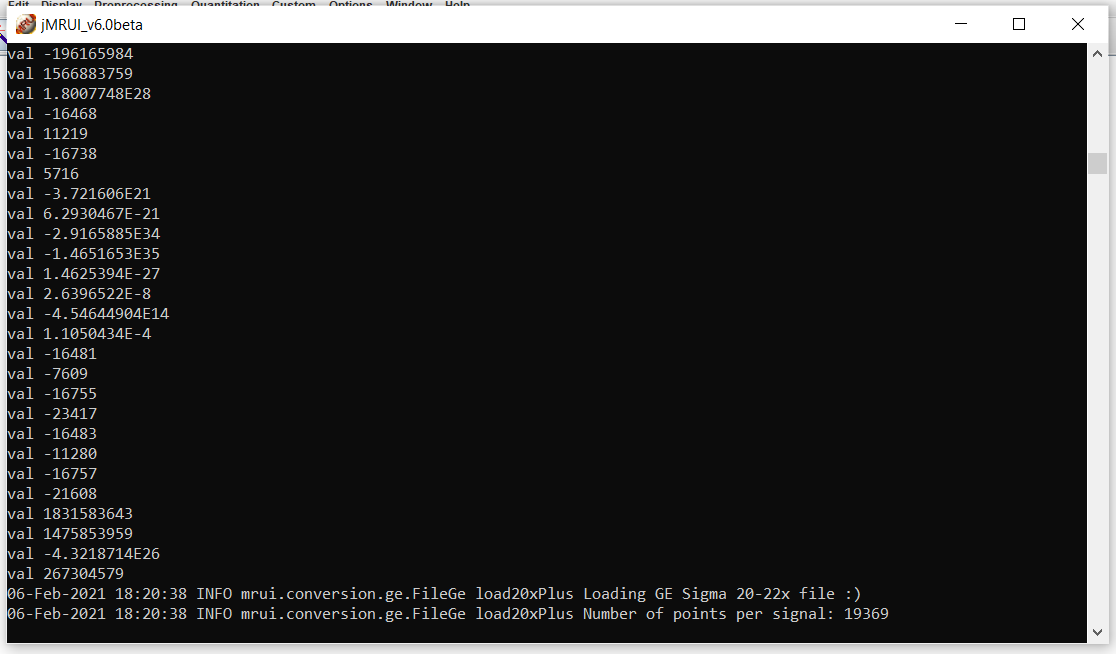
This is the error I get with one of the corrupted files (or so we thought!)
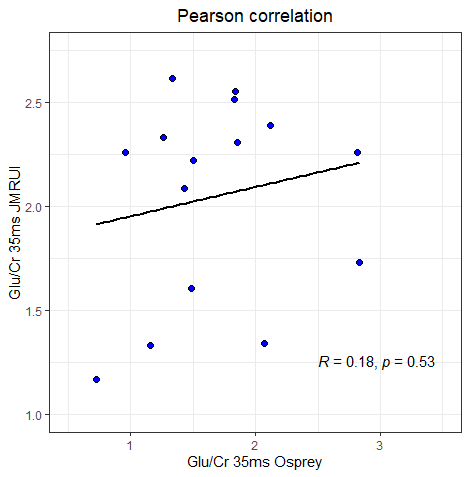
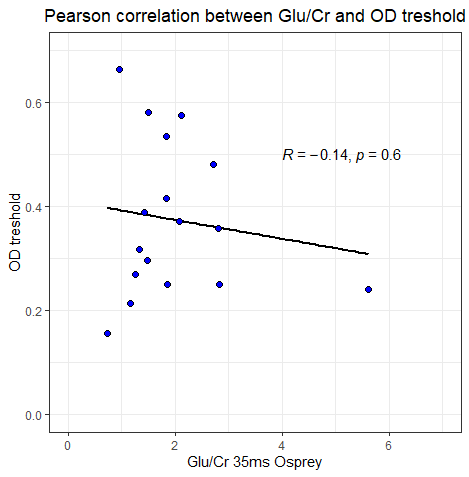
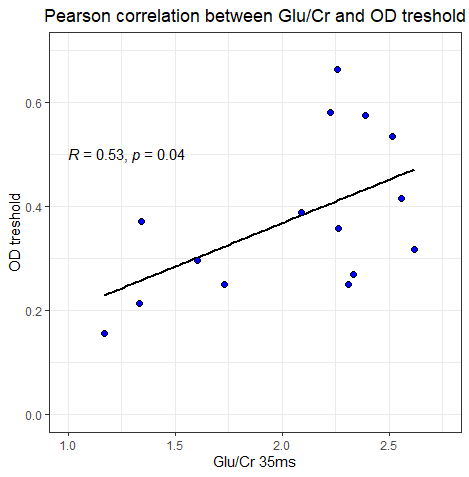
We also looked at a relationship between the functional task (visual orientation discrimination) and Glu/Cr ratio. The results between Osprey and JMRUI are very different.
Thank you very much for your reply. We used QuasarX. Could Jana still help and how can I get in touch with her? We included macromolecules in our basis sets but not sure if it was an in vivo measurement.
Thank you for your detailed feedback, this is very helpful. I hope it is okay if I collect the responses to each message in this one response here, rather than hit the Reply button separately for each:
It’s been a while since I’ve used jMRUI, to be honest (and hence, I really can’t make much sense of the error message that it shows… but it seems to read a GE file???). Are all of these steps performed manually, for example the alignment of the individual averages? What is the rationale for removing the first 9 averages - are these dummies? On Philips, the dummy scans aren’t saved in the SDAT files, if I remember that correctly.
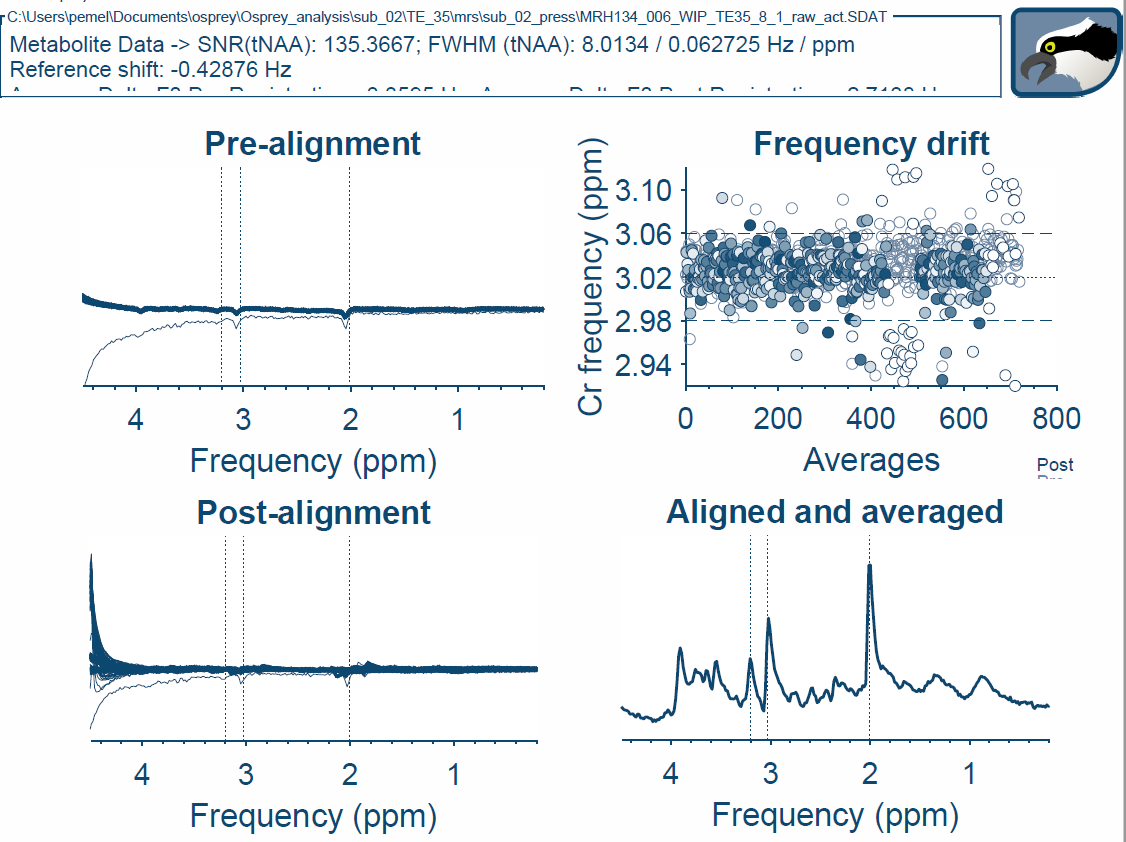
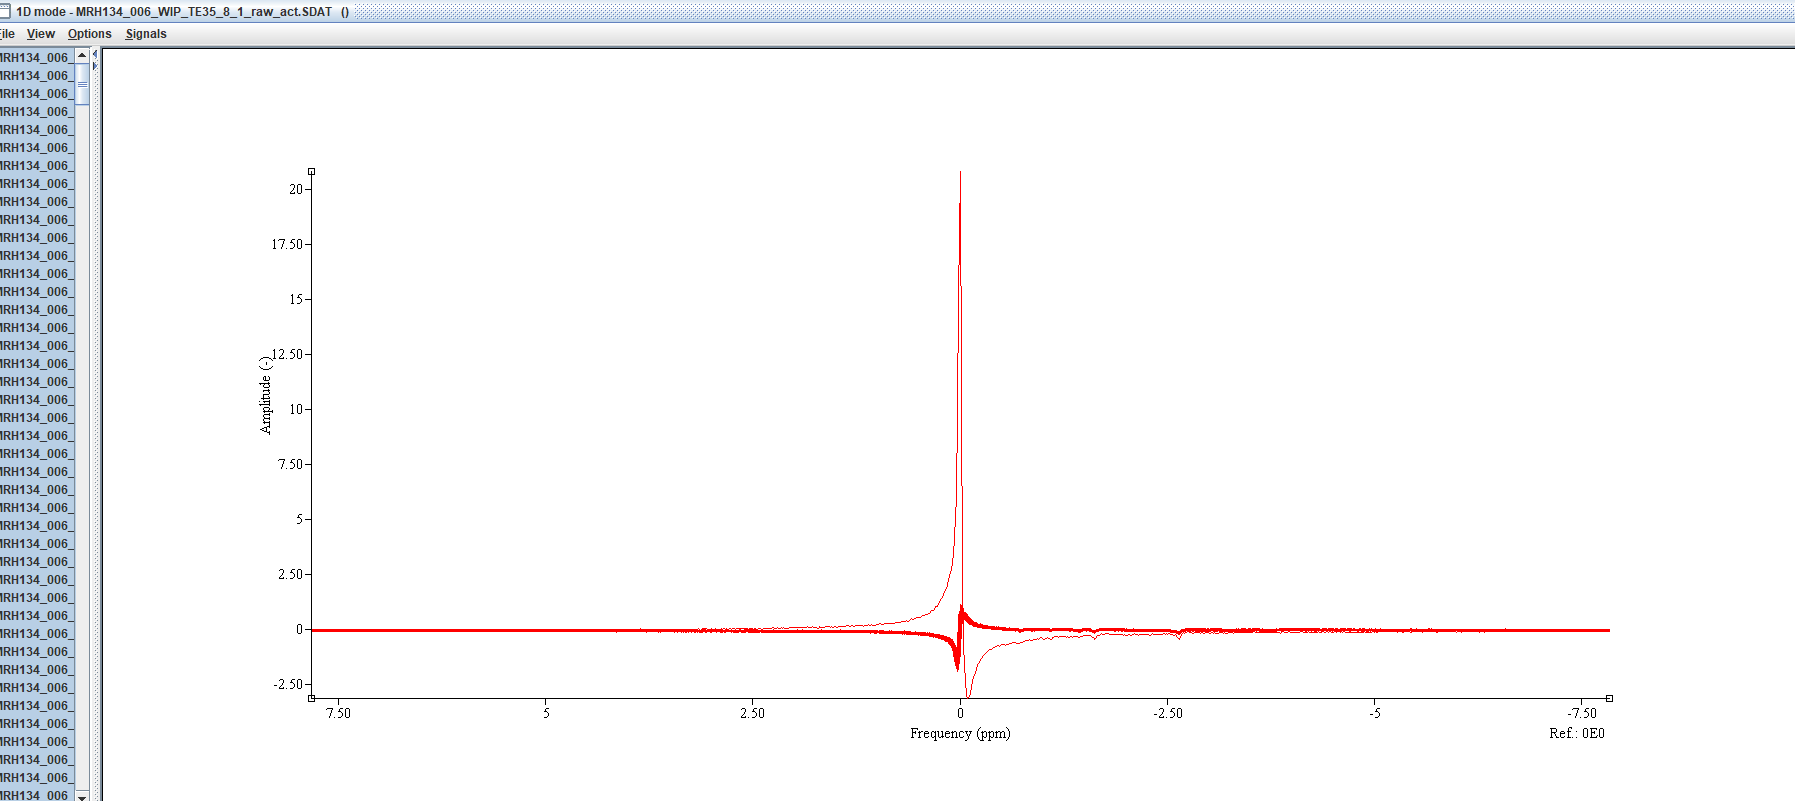
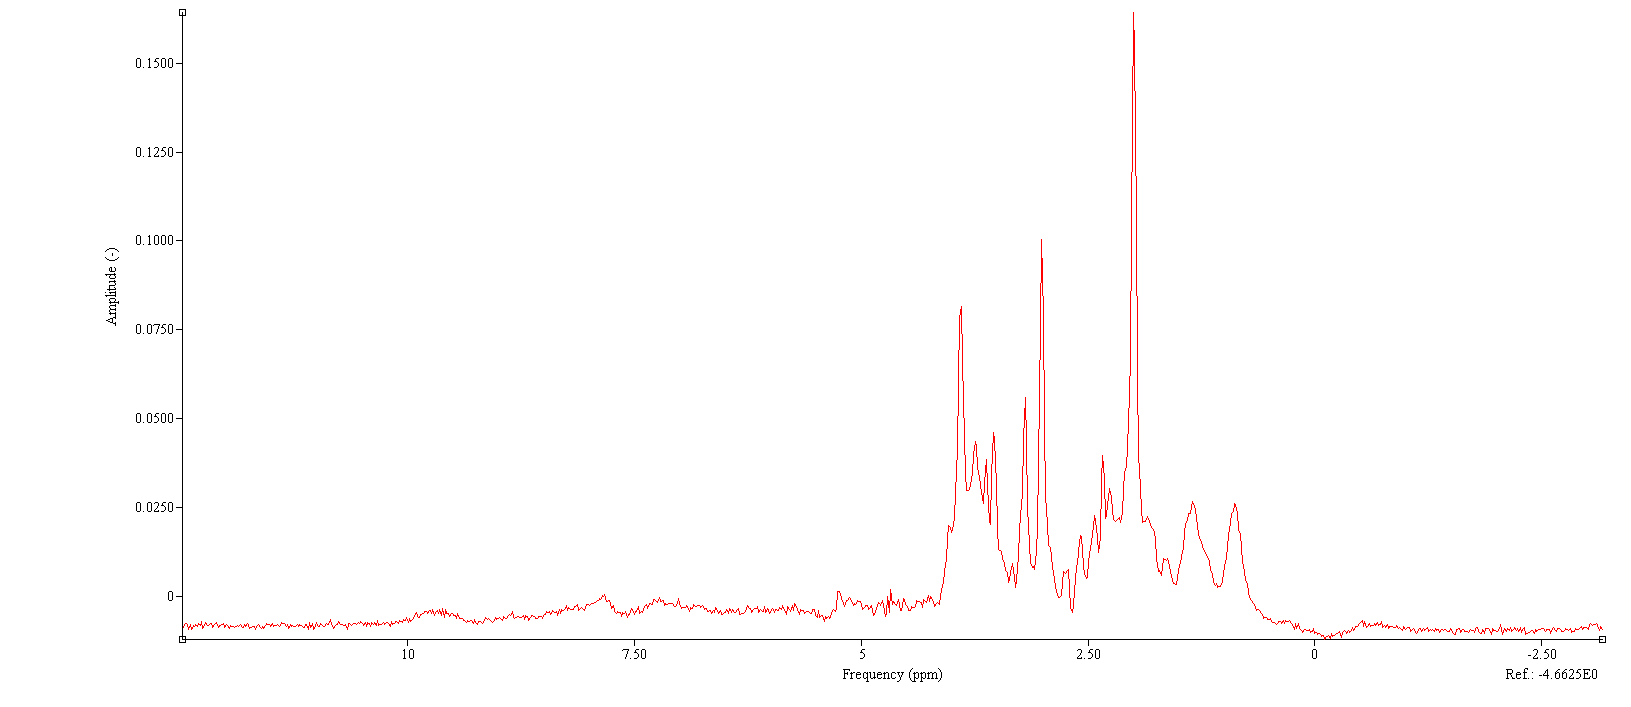
The pre-processed jMRUI spectrum you show looks good to me - the Osprey one is a bit off-phase, which might be due to the large residual water peak. In addition, the frequency/phase alignment in Osprey appears to mis-register a few transients. My guess would be that these are some of the first 9 averages? There is one average in particular in the pre-alignment plot that appears to be different from all the others likely the first. Alignment and phasing in pre-processing are generally a bit tricky, especially if there’s a lot of nuisance signals from lipids or water in there. We can hack your Osprey pipeline a little to remove the first 9 or so averages and see whether that goes away - feel free to send an e-mail or DM to get in touch.
Obviously, the different modeling strategies will have an enormous impact. It certainly makes a difference that the basis sets you use are not the same. How did you generate the one in jMRUI? I understand that QuasarX is basically the QUEST algorithm with a few meaningful constraints, is there a reference somewhere what these constraints are? It would also be good to know how QuasarX treats the baseline, macromolecules etc. (baseline in the jMRUI fit does look a bit funky).
This might be just the particular dataset you picked, but the Osprey fit also looks a little off here (which might be a result of the pre-processing gone a little haywire). In particular, I’m concerned about the lineshape of the model. When we started developing Osprey, we tried to model it after LCModel, and therefore included a lineshape convolution in the non-linear optimization, but didn’t include regularization (as in LCModel), mostly because it was really difficult to get right, and there is just no information out there on how to choose the regularization parameters. This worked really well for all of our test data, which, however, was likely a bit biased towards high quality (mostly the publicly available Big GABA and Big PRESS datasets). As we are seeing more and more real-life data rolling in, I think we’re beginning to realize that the lineshape affords too much freedom to the lineshape (I’m quite seriously thinking about removing it altogether in the next Osprey iteration). The question is - do all your fits show a lineshape like this? In that case, we should probably prioritise removing the lineshape from the model term so that you can test another model.
We’re happy to simulate basis sets for the other TEs for you, that shouldn’t take too long. I’m hoping we’ll have some time/resources to generate a larger library of basis sets in different formats over the year… just need to find the time to automate the process (and manage not to attract the scorn of our center manager for blocking the cluster ).
Does all this make sense? I realize that these are less definite responses than what you were looking for. But as with all things MRS, there’s usually more than one aspect to consider. I hope I didn’t make things too complicated now. As mentioned above, please feel free to reach out directly, I’d be happy to help you tweak the script to kick out the first 9 averages.
Thank you for the prompt and informative reply. I’m sorry I had to upload screenshots in multiple posts
Yes, we also noticed ‘GE’ bit but the files are definitely from Philips scanner. Very puzzling! We also tried to open them on different computers/different JMRUI version, the result is still the same. The alignment is automatic but can also be done manually; application of HLSVD filter is manual as setting reference. Removal of first 9 averages was a quality control.
I agree, it could be down to these first 9 averages which we remove in JMRUI. That will be brilliant of you can hack my pipeline, thank you! I will get in touch as suggested.
The basis sets we use were generated in NMRScop-B part of JMRUI. If I am honest, I am not entirely sure. We use ‘subtraction’ as background handing. The macromolecules use Gaussian line shape/metabolites Lorentzian line shape and equal damping. Apologies if this doesn’t answer your question.
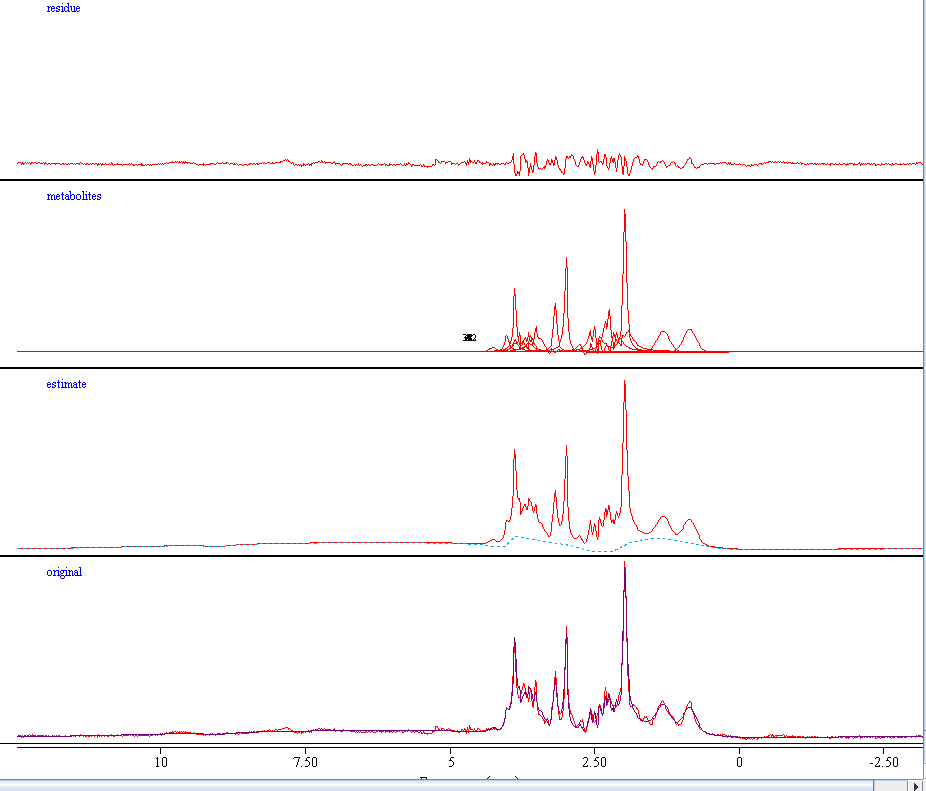
To answer your question, the lineshape is quite similar on all subjects. I am including one more subject below. I will be happy to send some raw data if you prefer to test it yourself. MRH134_005_WIP_TE35_9_1_raw_act_OspreyFit_off_off.pdf (138.8 KB)
That will be fantastic, thank you so much!
Yes, all makes sense, thank you. Indeed, a lot to consider. Overall, I think it’s great to generate this sort of discussion and try to get to the bottom of the problem
Thanks, I’ve received your e-mail and will respond to that as well. I’m still going to write a few sentences here that might be helpful for others:
I do see two distinct Gaussian MM signals (around 0.9 ppm and 1.4 ppm) in the jMRUI fit that you shared above, but I have a hard time distinguishing whether there are others, particularly in the 2-2.5 ppm region, and under the 3 ppm Cr peak. These are signals that are routinely included in LCModel, Tarquin, Osprey, etc., and will therefore influence the results of not only NAA, but also the Glu/Gln/GSH/GABA multiplet estimation, and of course the Cr referencing. We can’t assume that the baseline model in our algorithms will always absorb the signal variation arising from unaccounted MMs, particularly not if the algorithms differ so strongly in how they estimate the baseline… and I don’t know what “subtraction” as background handling means. Do you have a jMRUI manual that may shed some light on that function?
The second Osprey fit you shared has a better (more symmetric) lineshape estimation. I still think it’s worth doing the “remove first 9 averages” hack - let’s chat about that via e-mail.
Hi Both, I wanted to post a reply to thias a while back, but could find the time.
Polina, the GE error is something we encounter from time to time on our data as well. I’ve never really investigated why it happens in any systematic way, btu I know that I can get around the problem by using the “open as” option in the file menu, and selecting “Philips” as the data type.
The subtraction option for baseline fitting in jMRUI is interesting - and something @matt_rogan and I have been finding can change the data a fair bit. If we use “in-base” instead of “subtract” for baseline fitting the data are not that conparable. I hope to investigate that a bit more this week.
I am not sure why not removing the first 9 shots would cause the issues you have in your OSPREY fits. the first data set you shared looks to have a phase issue in Osprey.
Thanks very much for your reply, very helpful! We were trying to figure out what to do with those files. A quick question, is there a way to open a ref file (getting the same GE error)? I can’t load it with “correct with ref file” option. I might just have to settle for a manual phase correction for this subject.
Not sure if this is helpful, one of Steve Williams PhD students looked at all baseline fitting options (subtraction, inbase, no) in JMRUI and found that the “subtract” worked best.

 ).
).
