Hi everyone!
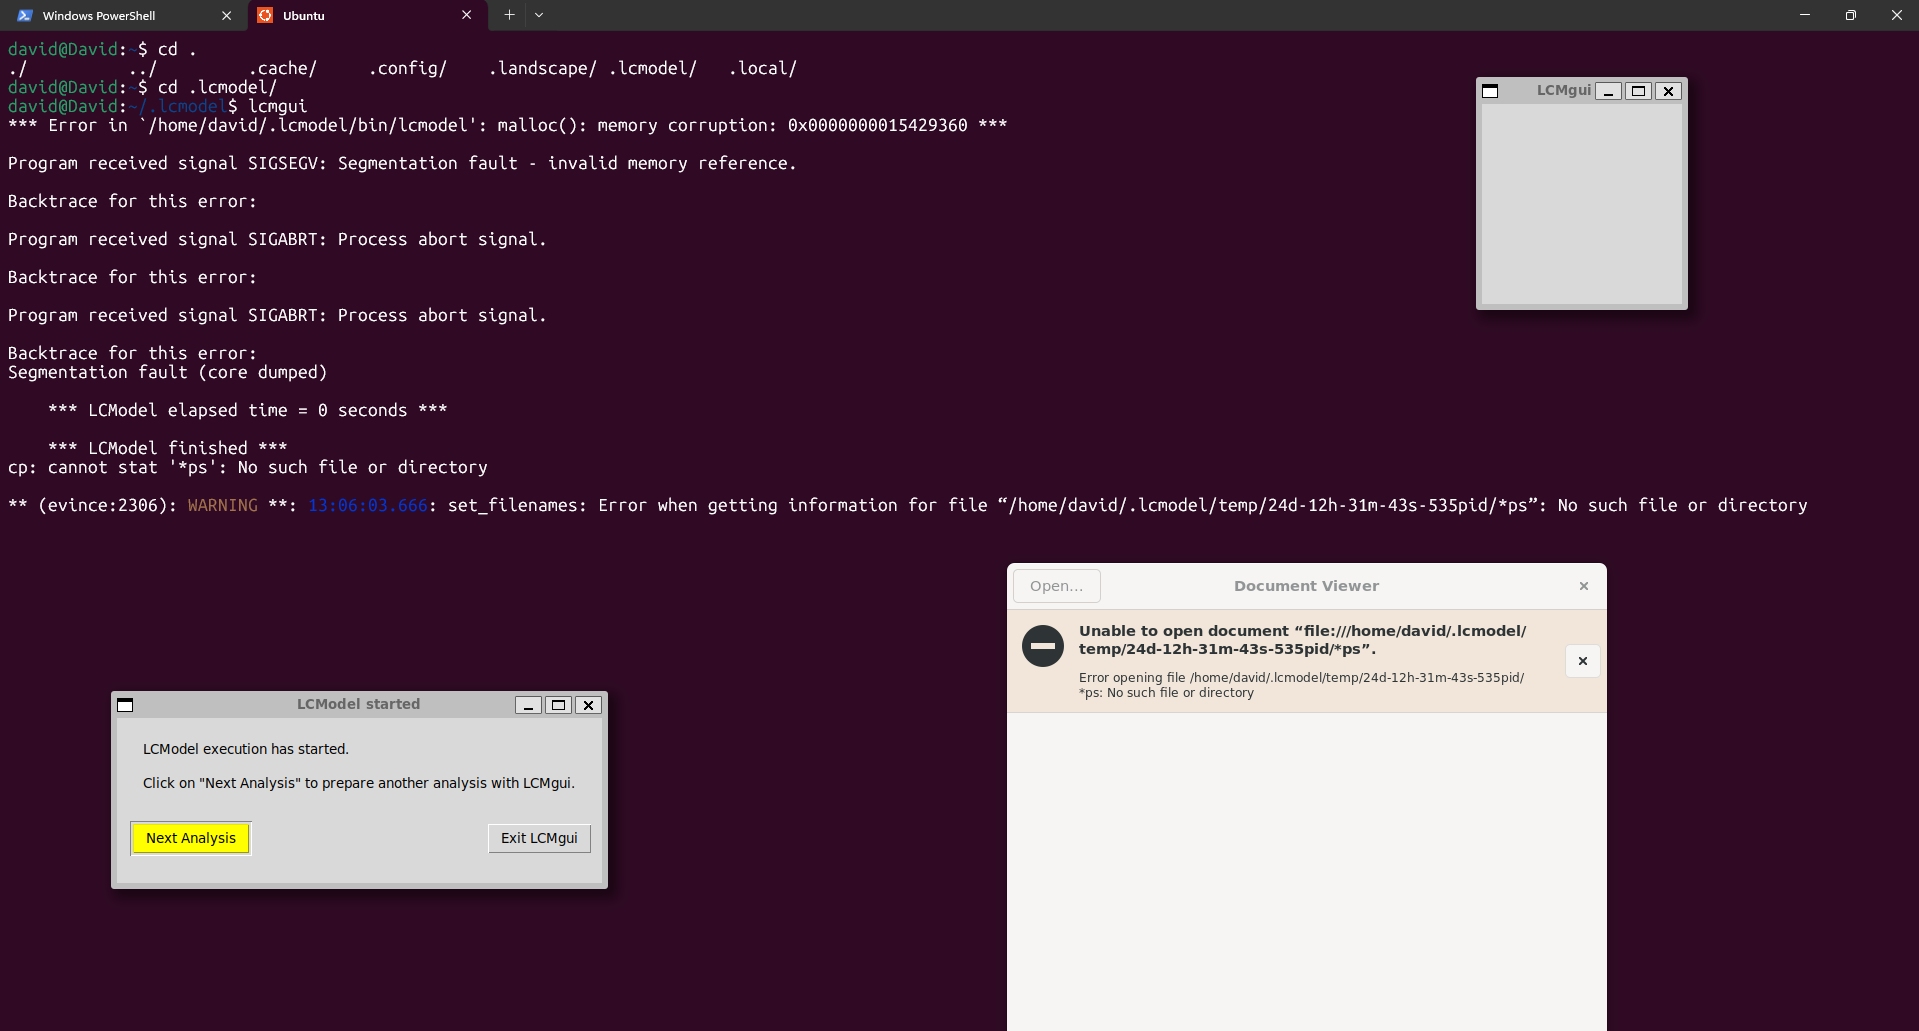
I am currently working on an MRS analysis to quantify hepatic metabolites. I installed LCModel on WSL/Ubuntu, but when I try to process my data with the GUI, I get this error. My data was collected on a Phillips 3 T (¹H, 127.8 MHz) using a PRESS sequence with these parameters: TE = 50 ms, TR = 2000 ms, 1024 points, sampling width 2000 Hz.
I recently joined this community. I would appreciate any guidance or comments.
Do you have full read and write access to the output directory? I’m not sure how these things might be affected by WSL.
Note that you can always run LCModel directly in Windows (albeit without the GUI, but learning how to write control files allows you to batch your data analysis, which is a huge time saver in the long run).
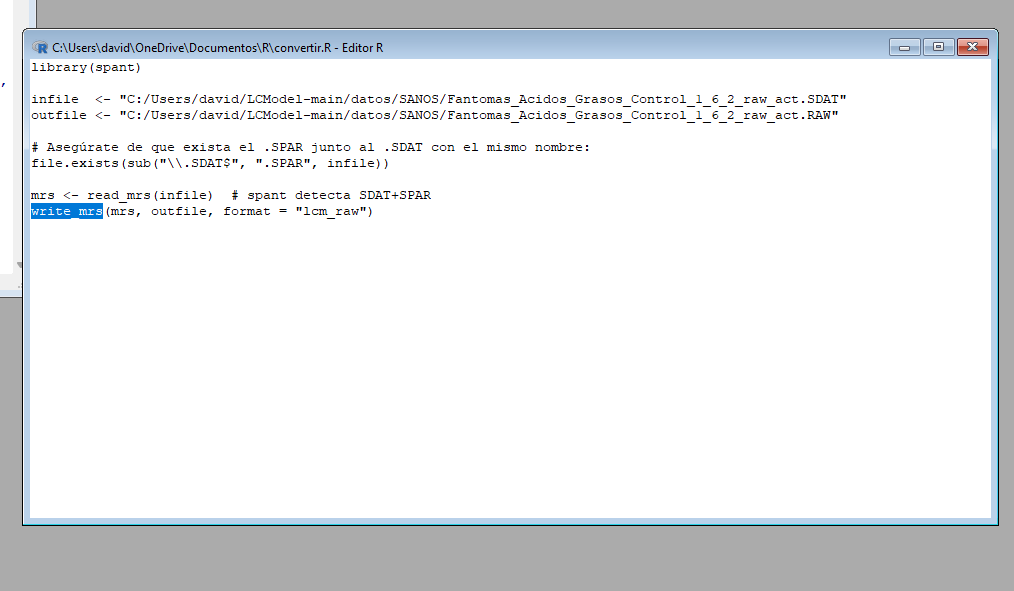
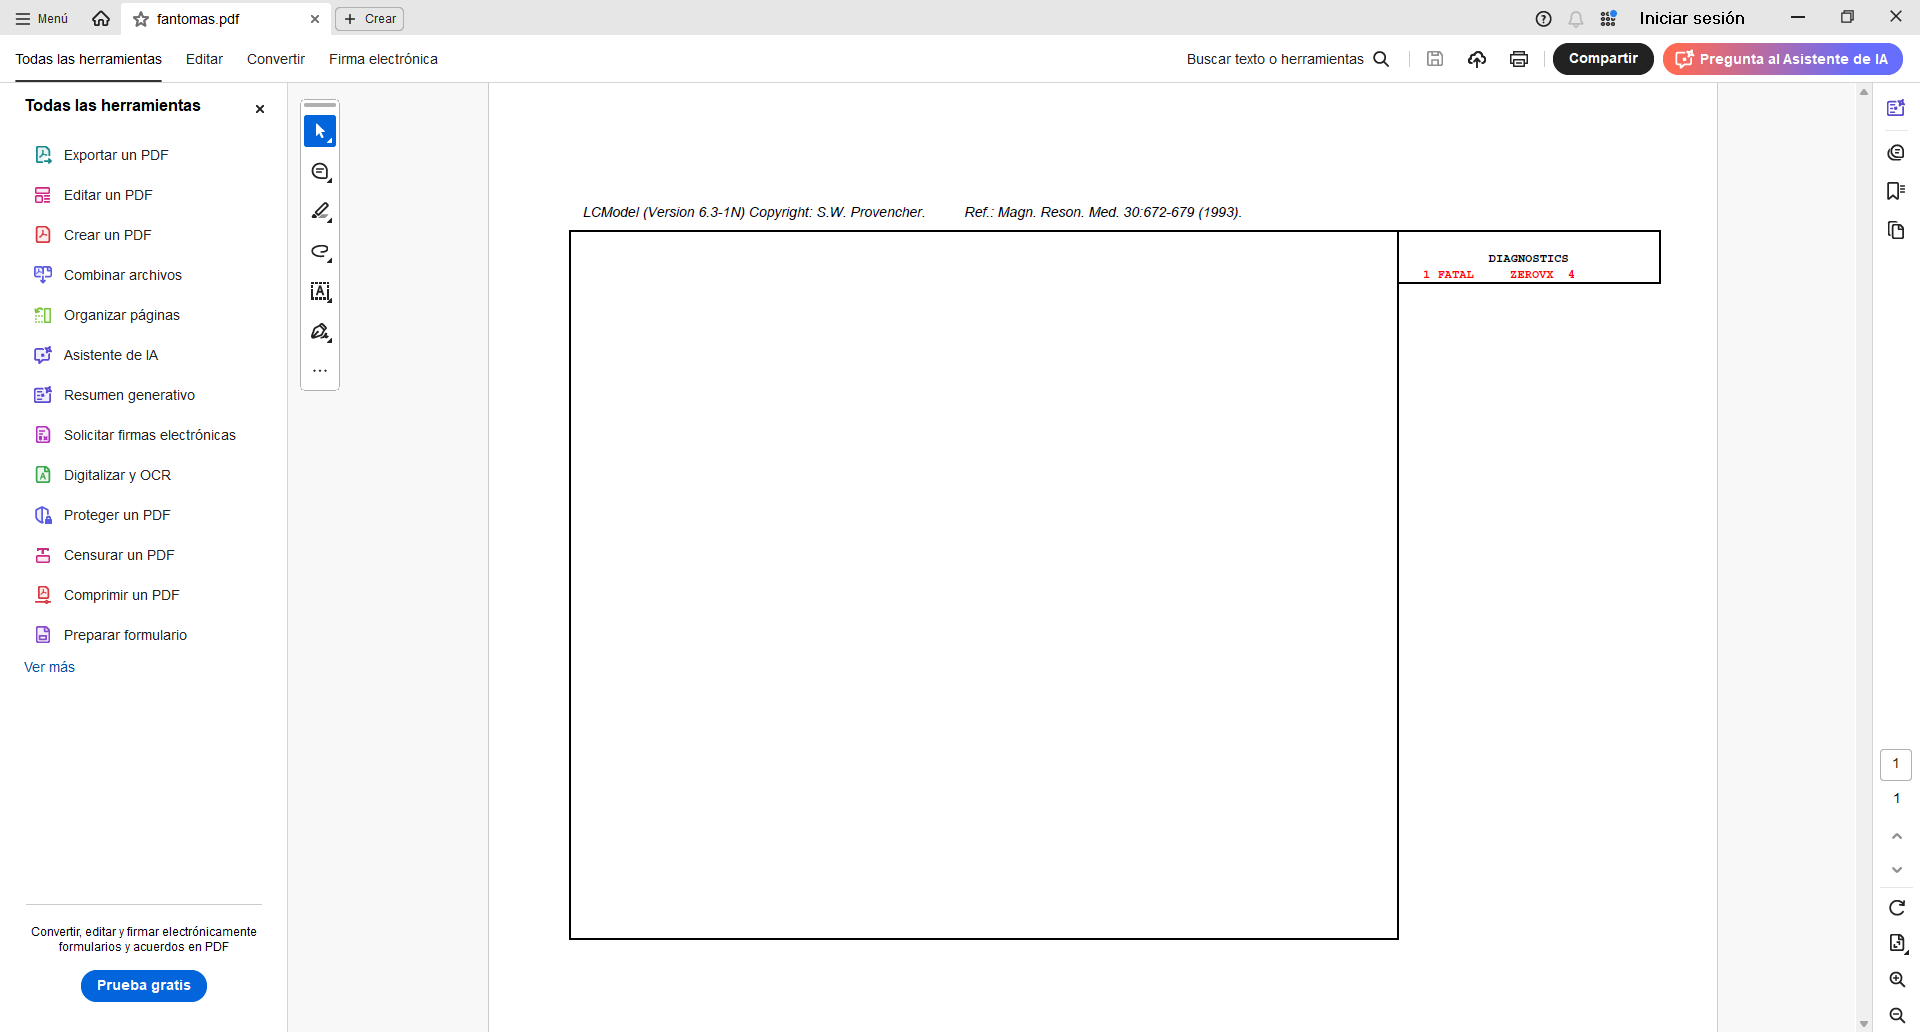
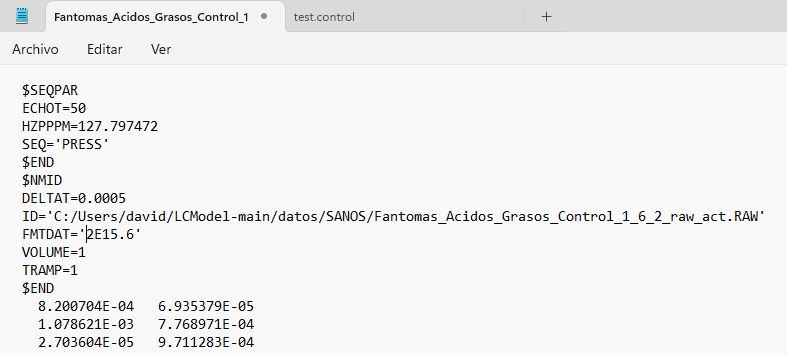
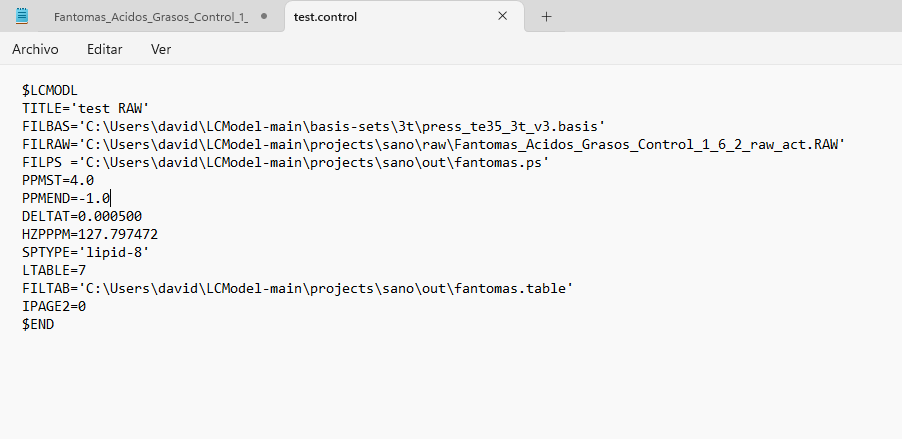
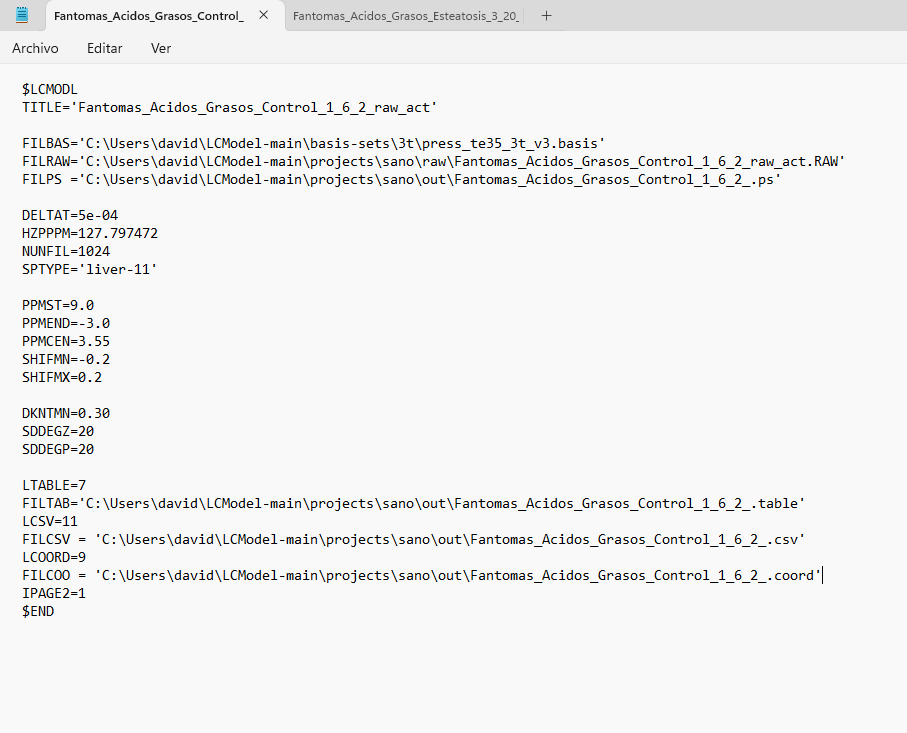
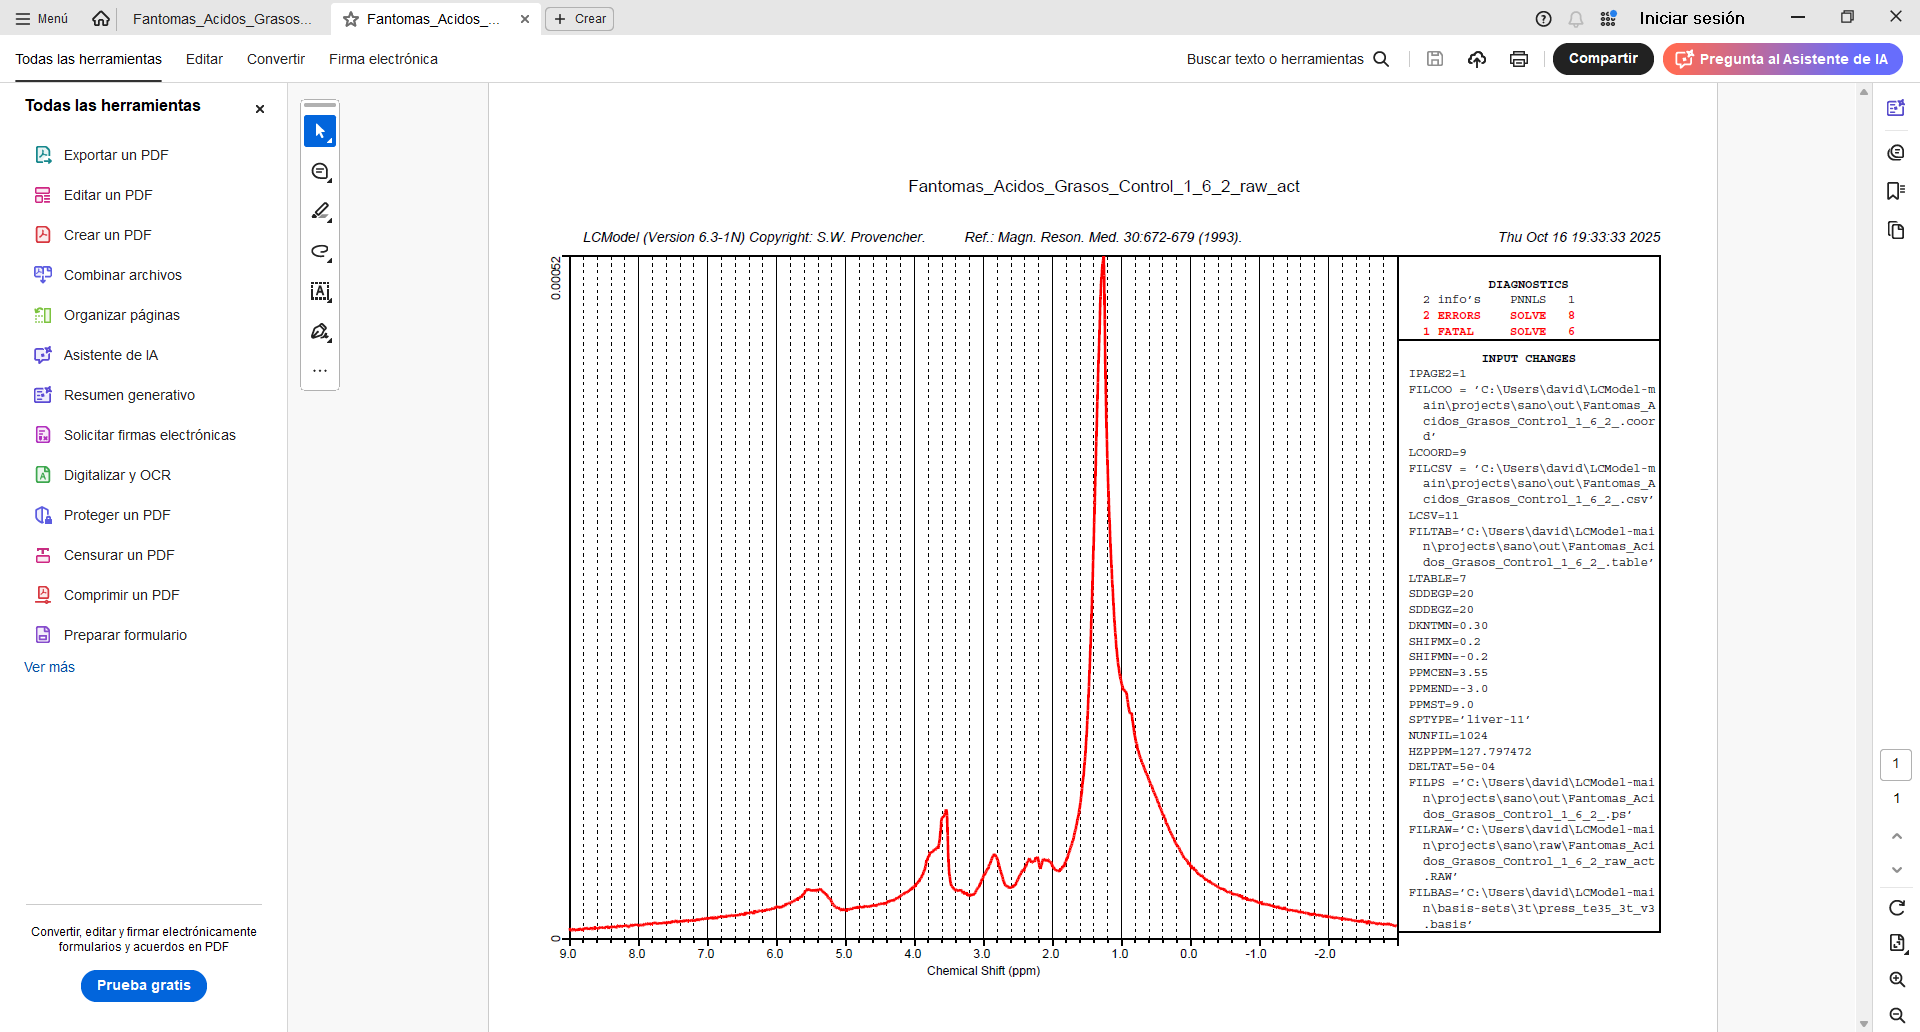
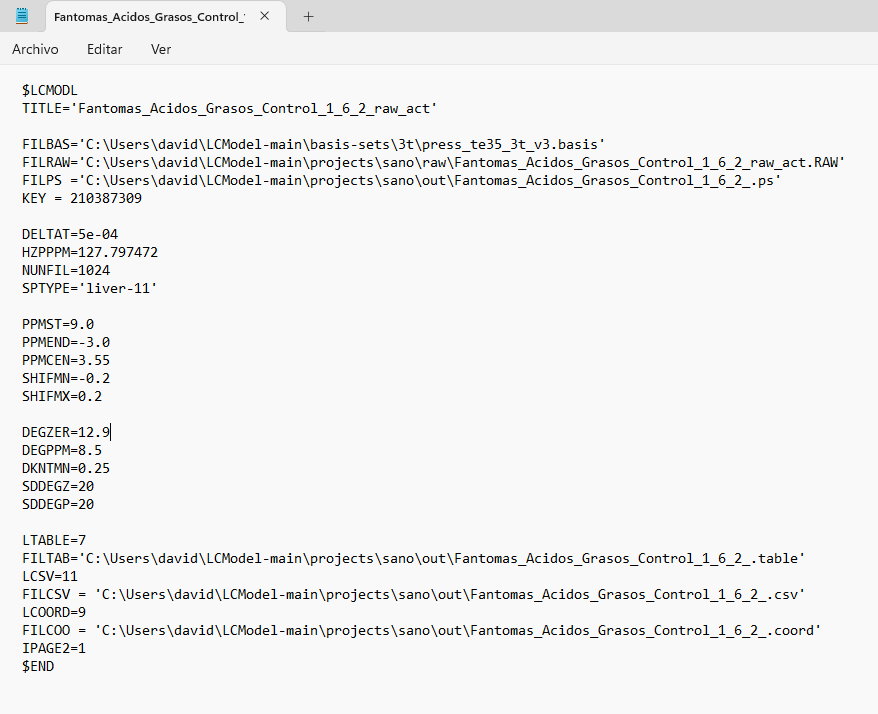
Hi Georg, thank you for your reply. Yes, the output directory had read and write access, but I couldn’t fix it. I started using LCModel directly in Windows and encountered an error that I can’t fix (ZEROVX 4). According to the manual, this is an error when trying to read the time data in FILRAW. I am attaching a screenshot of my .control and .raw files and the code used in R (I used the ‘write_mrs’ function from the ‘spant’ library) in case it helps.
Hm, it generally looks OK to me.
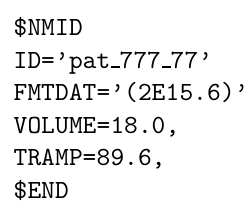
Can you try adding parentheses to the FMTDAT value with parentheses, i.e., FMTDAT='(2E15.6)', like in the example in the manual?
I tried it and the result is the same, the error still appears on the output sheet (ZEROVX 4).
Hm. I thought this wasn’t mandatory, but maybe your control file needs the number of spectral points in NUNFIL (see LCModel manual section 5.3.1.)?
You can also try the FID-A toolbox for reading SDAT/SPAR data and writing them out as .RAW (just as a control case - I haven’t used spant in a long time).
I just solved the problem. The “write_mrs” function must be used with the .SPAR file, and I was using it with the .SDAT file. However, new problems have arisen.
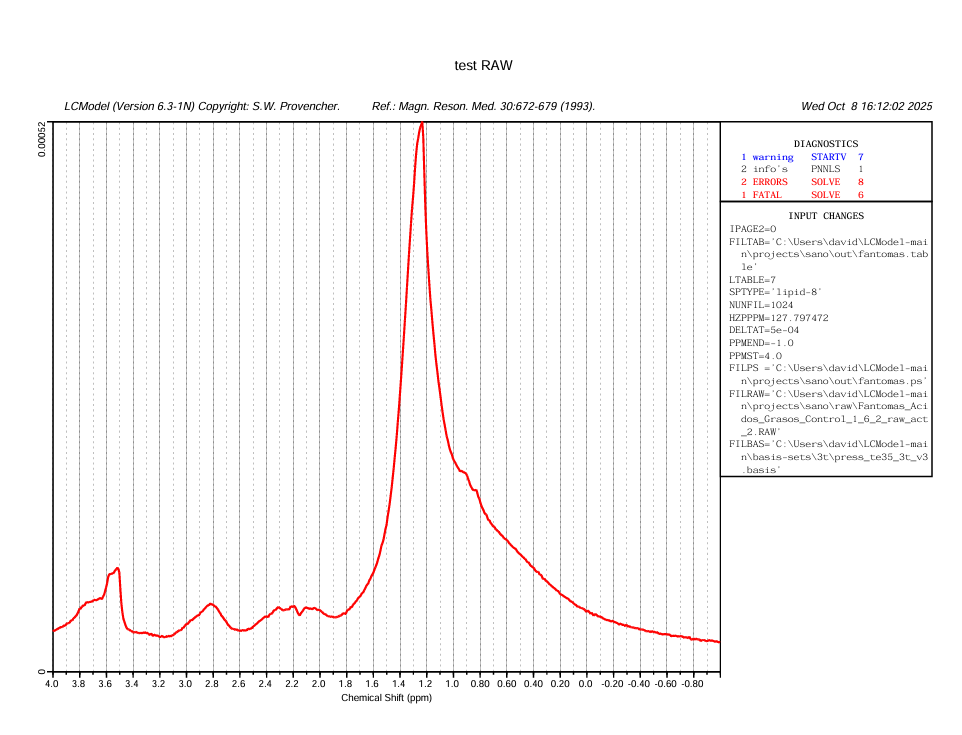
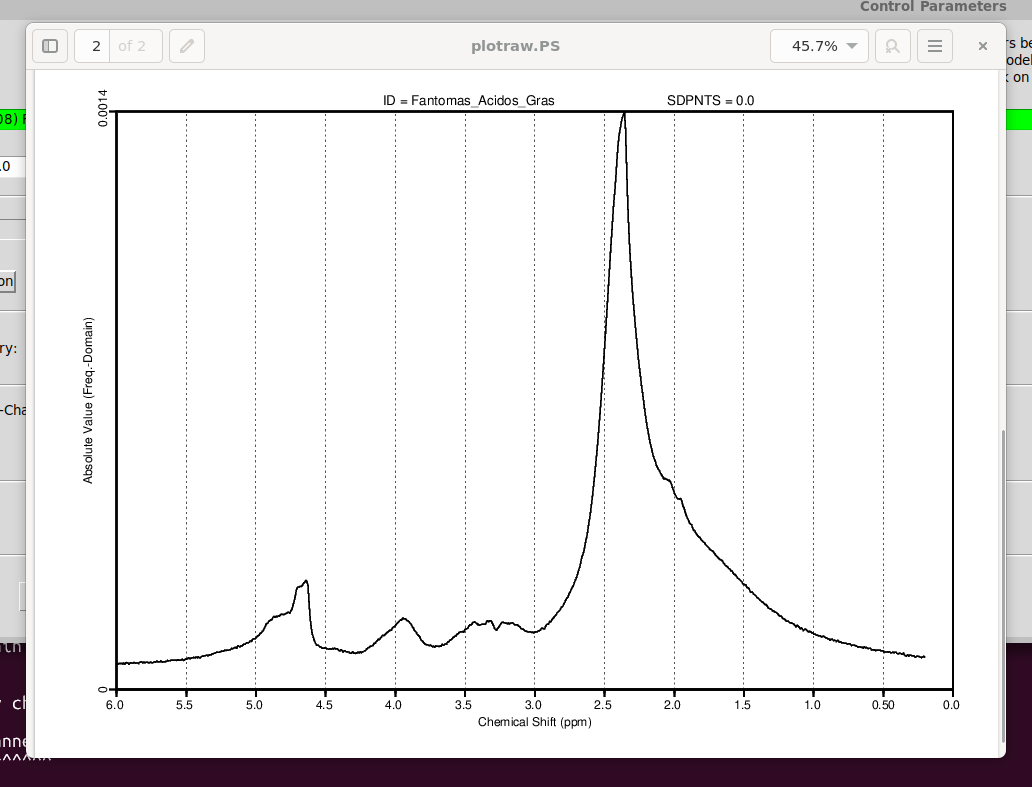
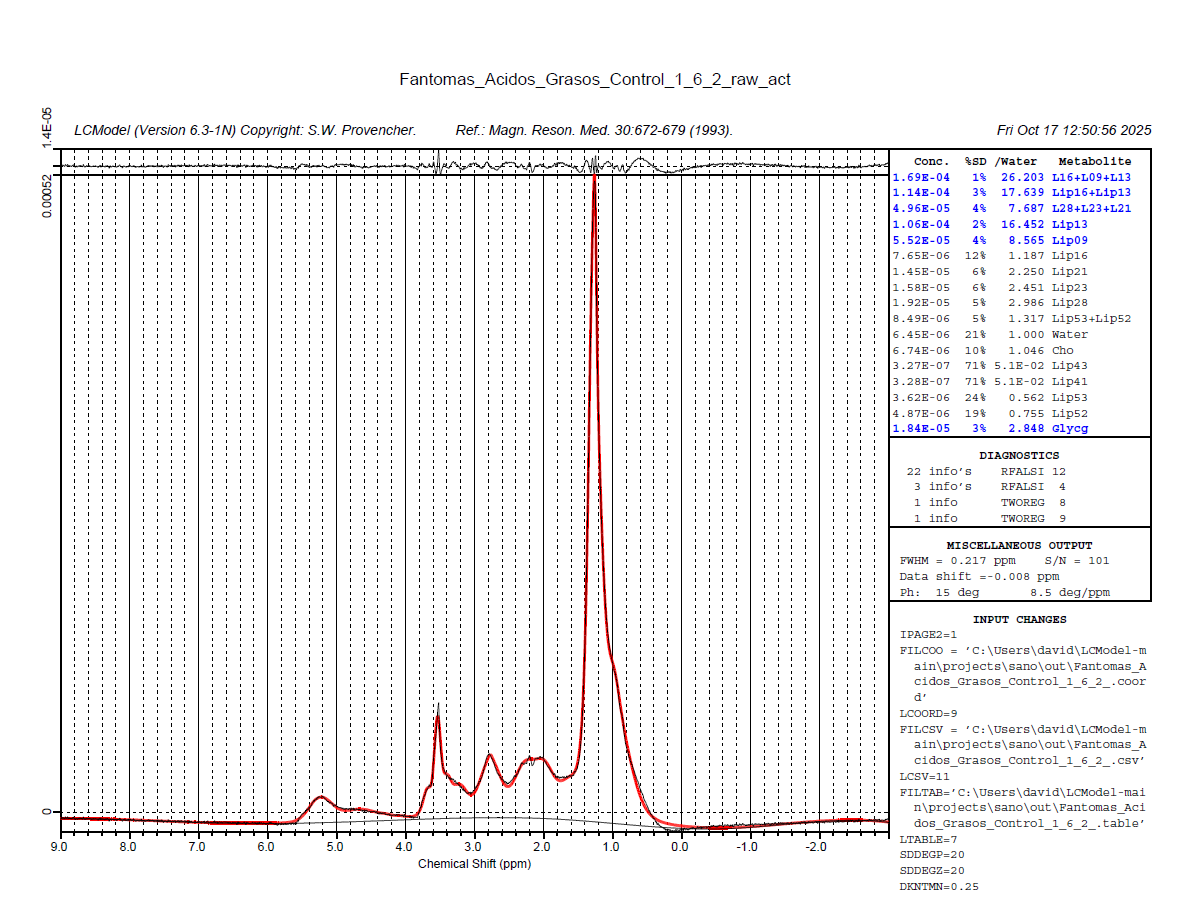
Your plot in the very first post tells me there is something wrong with the center frequency of your input spectrum. The largest signal (the lipids) should appear at 1.3 ppm, but they instead appear at 2.3 ppm.
I suspect that the barrage of errors you see in your latest figure (startv 7, and the various solve ones) somehow relate to the estimation of the initial attempts at finding the correct initial frequency shift.
You can try by modifying the control parameter ppmcen (see LCModel manual section 11.3.1). Given that the initial plot showed to be about +1 ppm off, try with a value of 5.65 ppm (try with the other direction, i.e. 3.65, if it doesn’t work).
1 Like
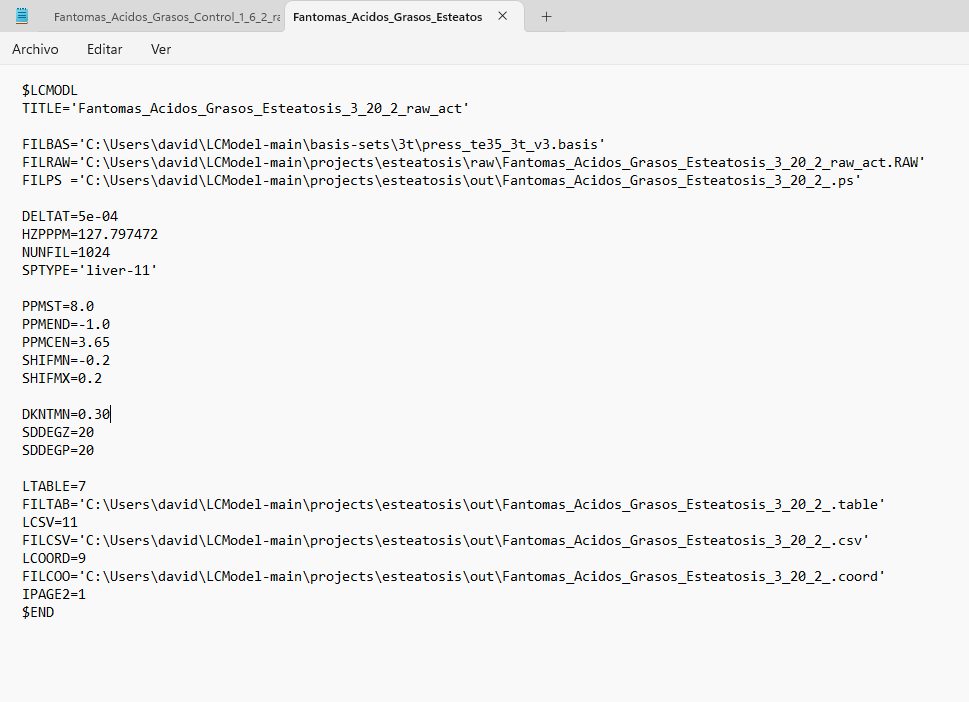
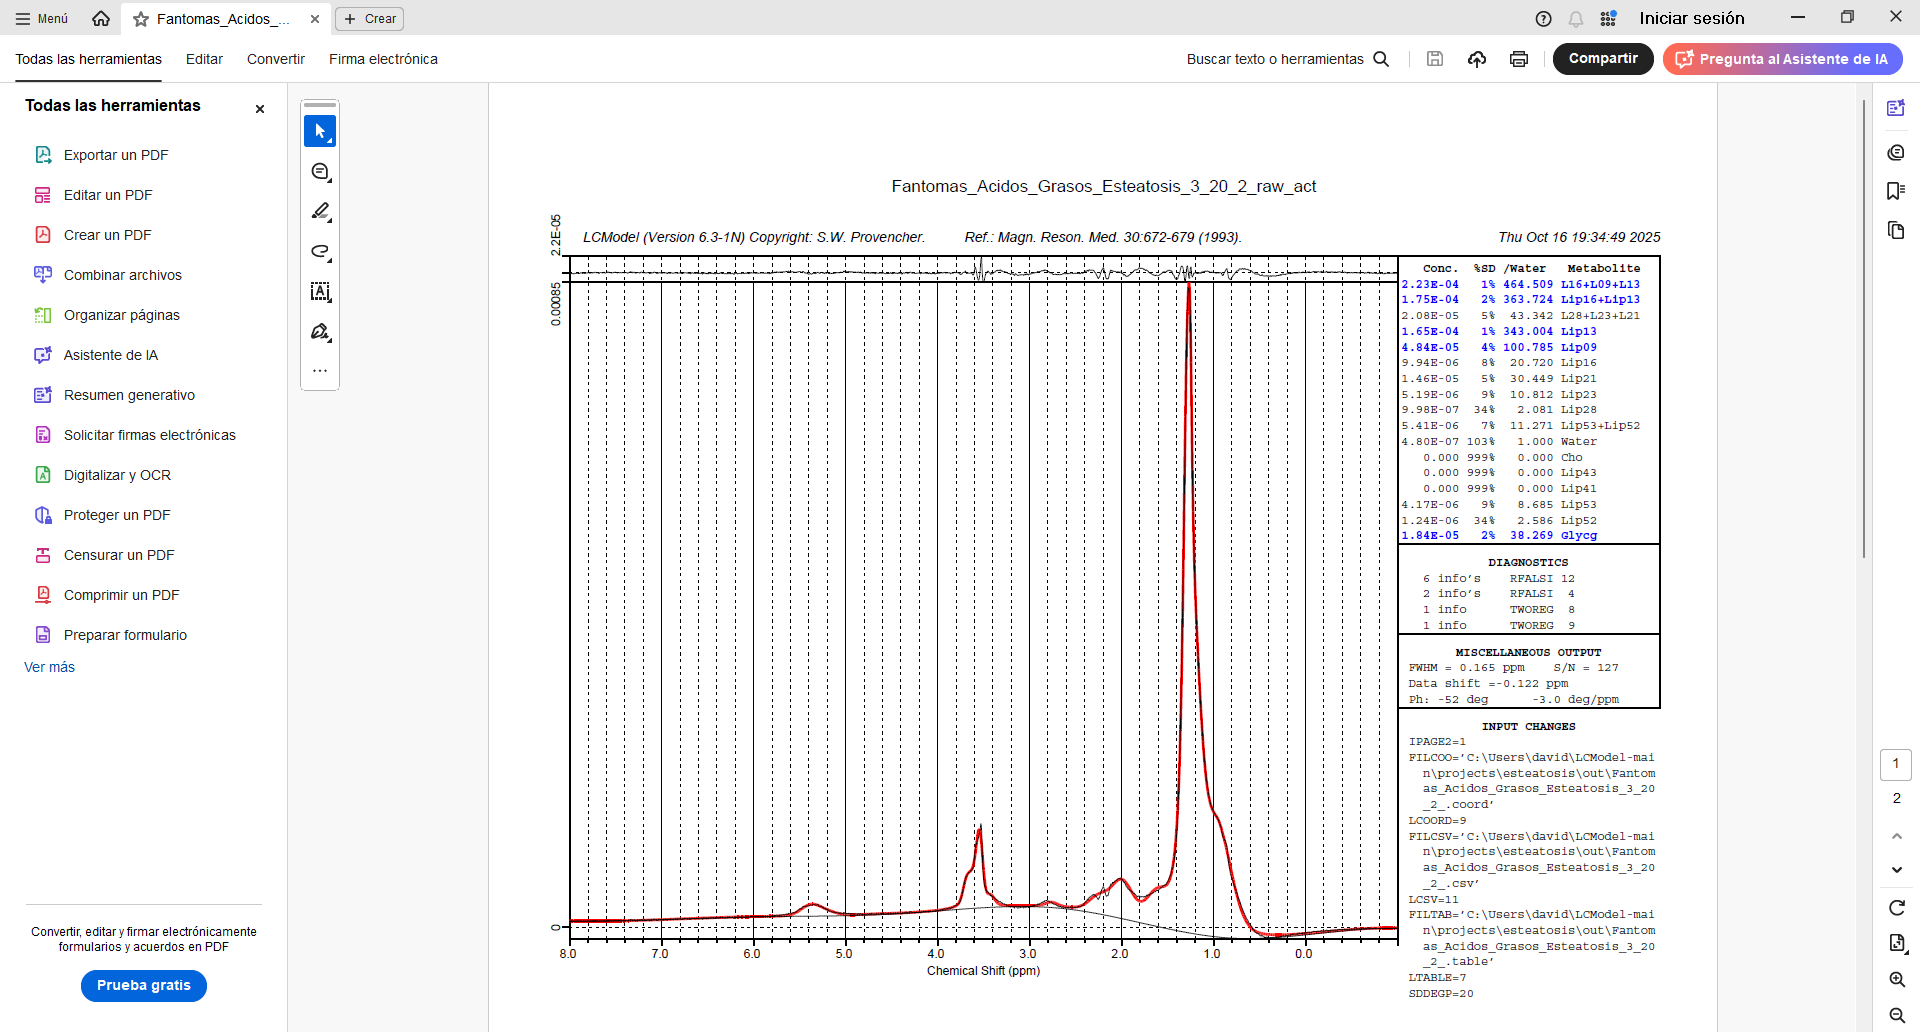
I tried entering PPMCEN = 3.55 and managed to adjust the peak to 1.28, but the problem persists. I tried analyzing another spectrum and got good results. But I still don’t understand why the program continues to give errors with the first spectrum, since I used similar parameters. Here is a screenshot of the .control file for both spectra, along with the results.
Hi,
I use LCModel on Windows 10 WSL/Ubuntu and it works without any issues.
Installation according to the LCModel home page.
What is important: to set the licence as suggested:
LCModel’s home page
AND! not to forget: every control file needs the key entry too, as stated here e.g. !!!
MR Spectroscopy with LCModel — Neurodesk
Note: LCModel is now a free software, but still requires a license key for execution. The key = 210387309 is a universal license key provided by the developer for non-commercial academic use. It must be included in the LCModel control file (typically under the key parameter).
For details, see: LCModel's home page
For graphical output I use: VcXsrv, installer available: vcxsrv-64.1.20.14.0.installer;
settings: disable “native opengl”.
Installed evince (ps viewer) too.
Good luck!
Best,
Markus
2 Likes
That is very strange indeed. Have you tried using the same fit range as in the successful attempt, i.e., [-1 8]?
And the acquisition parameters are exactly identical between the spectrum that works and the one that doesn’t?
1 Like
I tried changing the analysis window [-1.8] and adding the license key as Markus said, but the same error occurred again (solve 6 and 8). However, when I added the phase parameters (DEGZER and DEGPPM), I managed to get results. Is there any way to improve the baseline? Since in the graph it appears below the x-axis.
1 Like
Glad that helps to pull the phase corrections straight - this can be tricky with lipid spectra.
I wouldn’t worry about the baseline too much, since the data is also below the ‘zero line’ (could just be one super-broad component underneath it all).