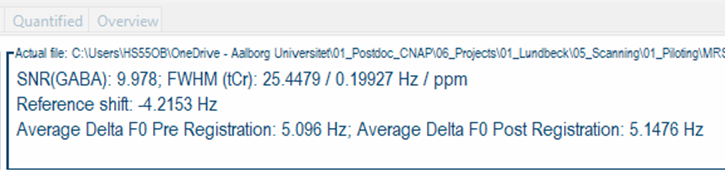
For one of our studies, we ran multiple MEGA-PRESS pilots over the past months. When analyzing the data, I noticed a difference between the analysis performed back in March and the analysis performed in June/yesterday. When - within the GUI - looking at the DIFF spectrum, the header showed me FWHM (GABA) back in March.
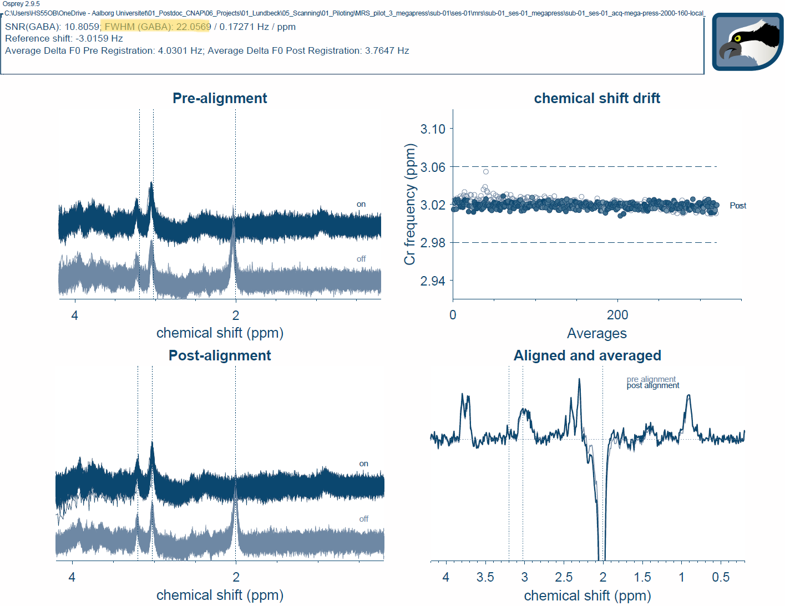
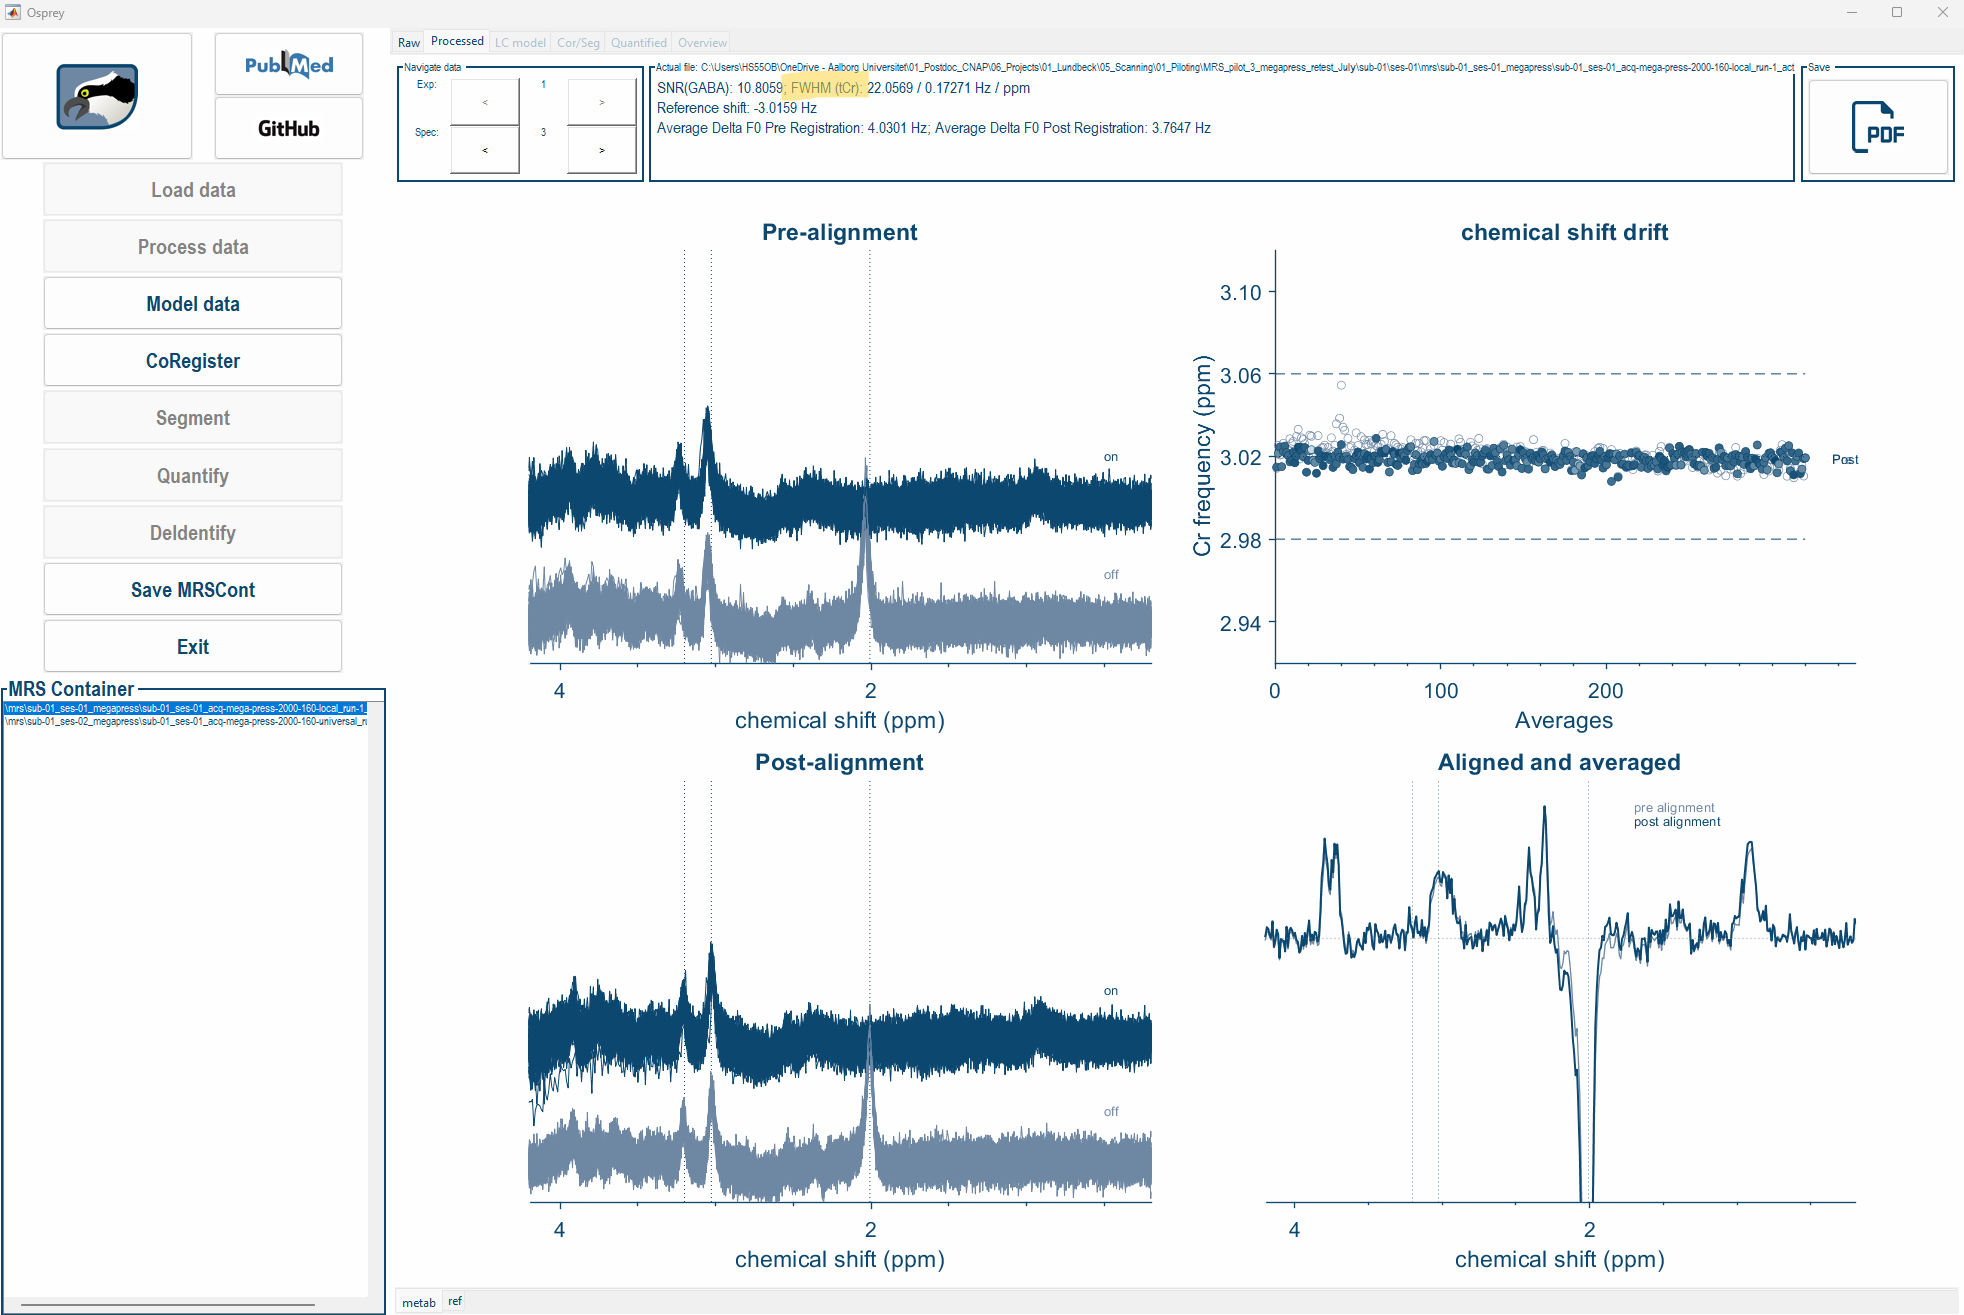
Now, the header shows me FWHM (tCr) but the values seem to reflect FWHM of GABA:
I am using Osprey 2.9.5 (downloaded February 14th 2025) and did not update anything since then. I also used exactly the same job file.
To be sure that it was not something related to the job file or other changes I may have made unintentionally, I reran the analysis from March - and I get the same values, but instead of FWHM(GABA), the header now shows FWHM (tCr).
Happy to share more screenshots (was not possible with the restricted new user-privileges).
Not sure whether that is important because to the best of my knowledge, these values are not typically used as quality measures and also not reported in the “QM_processed_spectra” file. Still seemed like something that might confuse people - like me.
Sorry for the late response! I’m surprised that you report that you’re seeing differences if you’ve been running the exact same analysis with the exact same Osprey version. Can you post a screenshot of the actual spectrum?
Hi Georg
No worries, the issue is not that urgent.
Interestingly, while I was looking for the correct figures to make the screenshot, I realized that this difference is only visible when looking at the data in Osprey itself. The exported figures are identical between March and now (showing FHWM (GABA) and not FWHM (tCr) in the header).
I am uploading screenshots of a different dataset (thus, the different values compared to the first screenshot I posted), because that is the one where I have screenshots from back in March and from now.