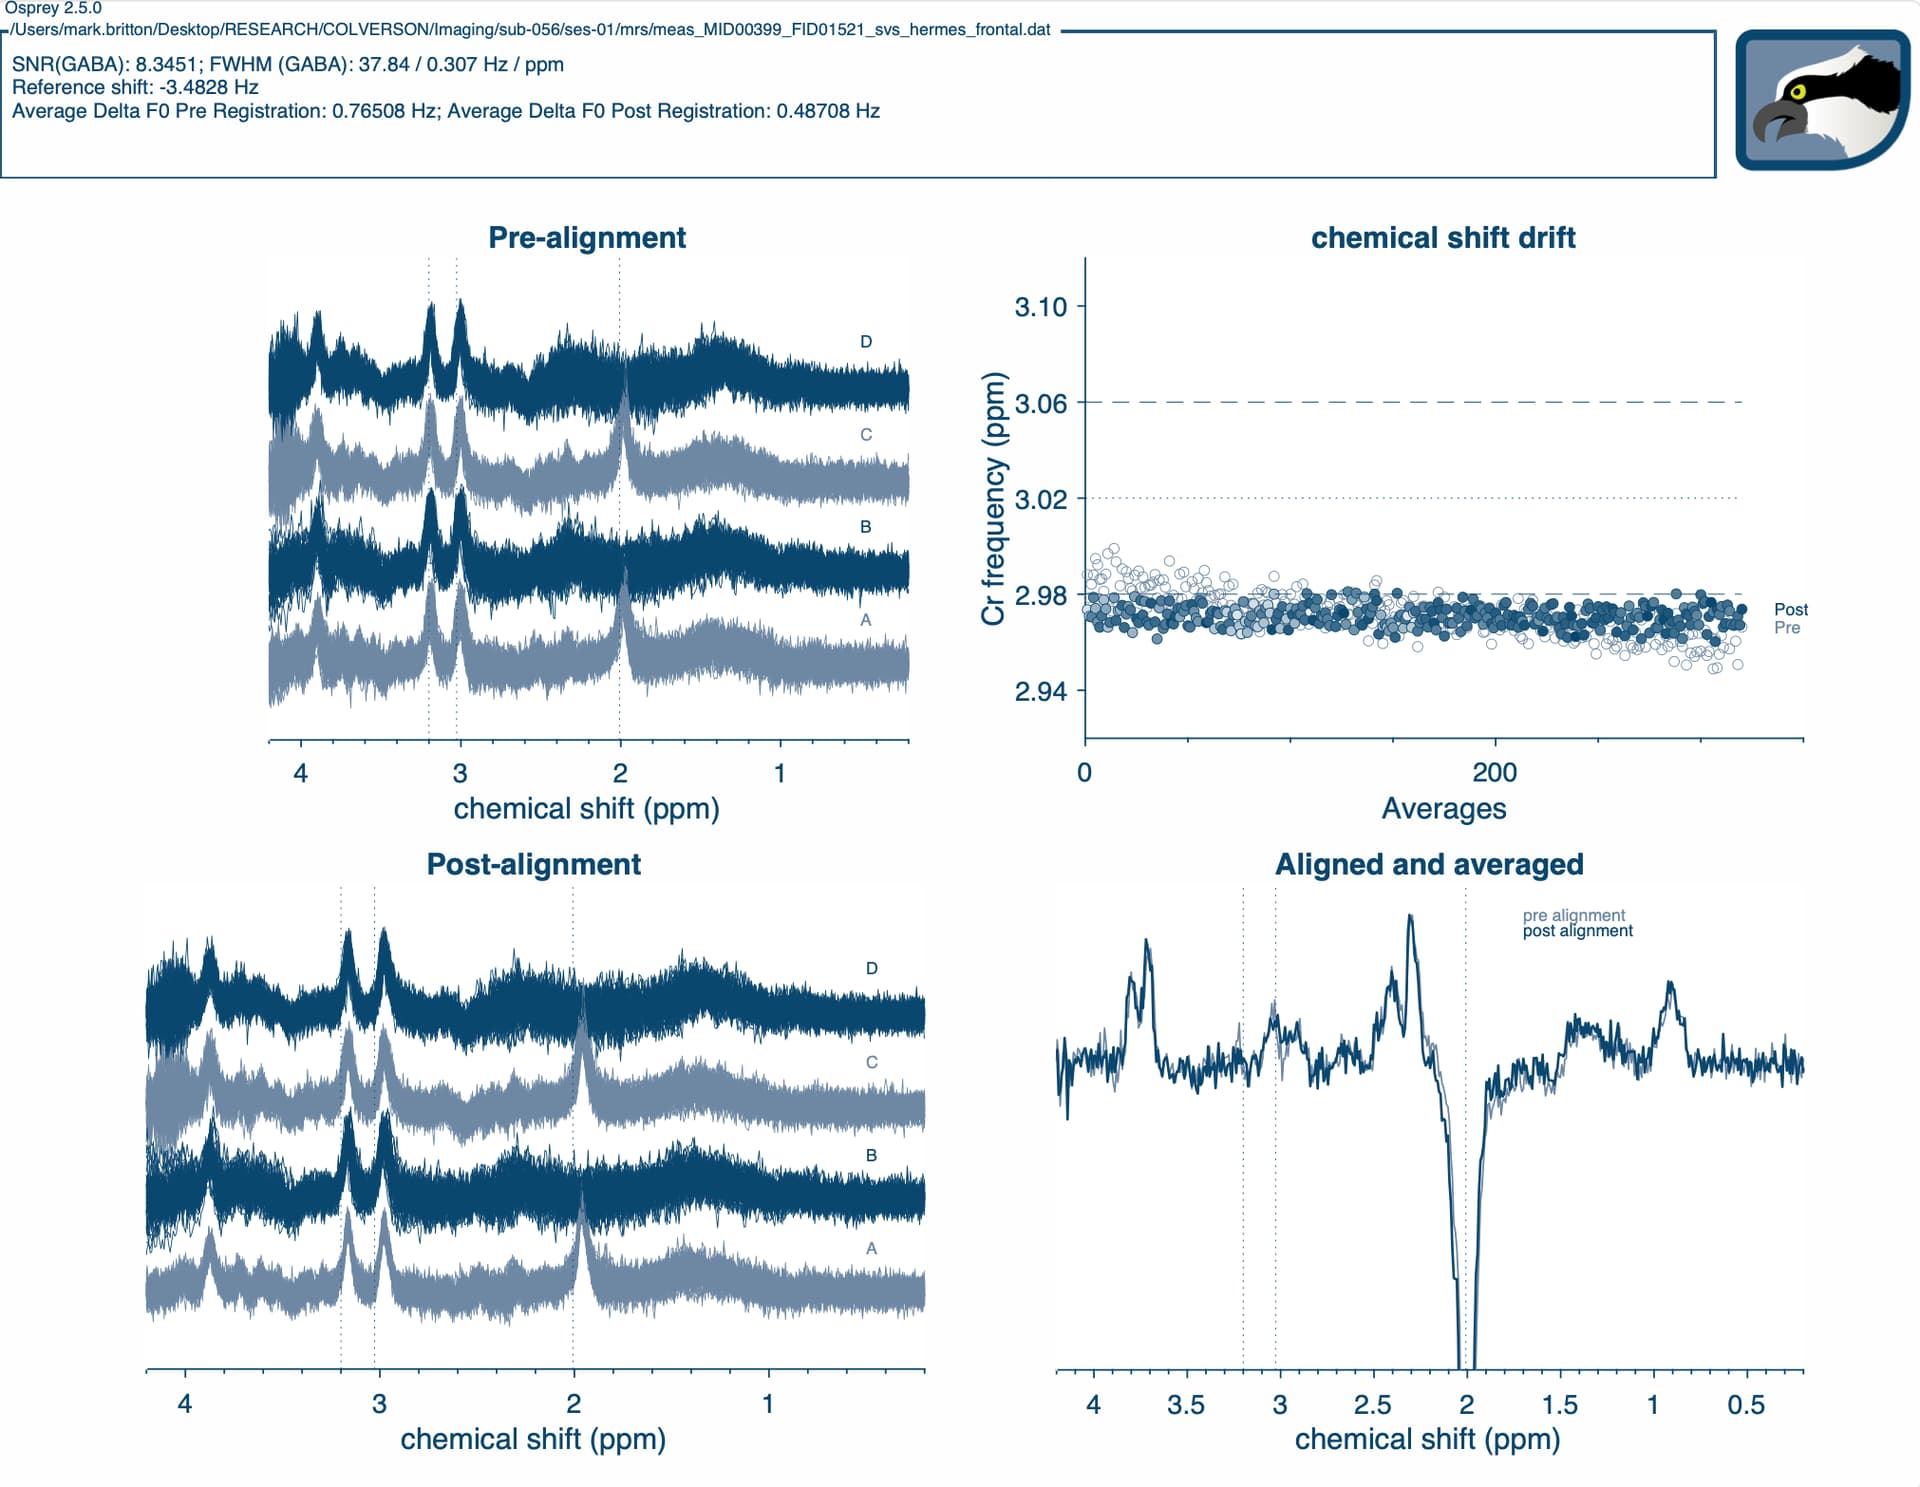
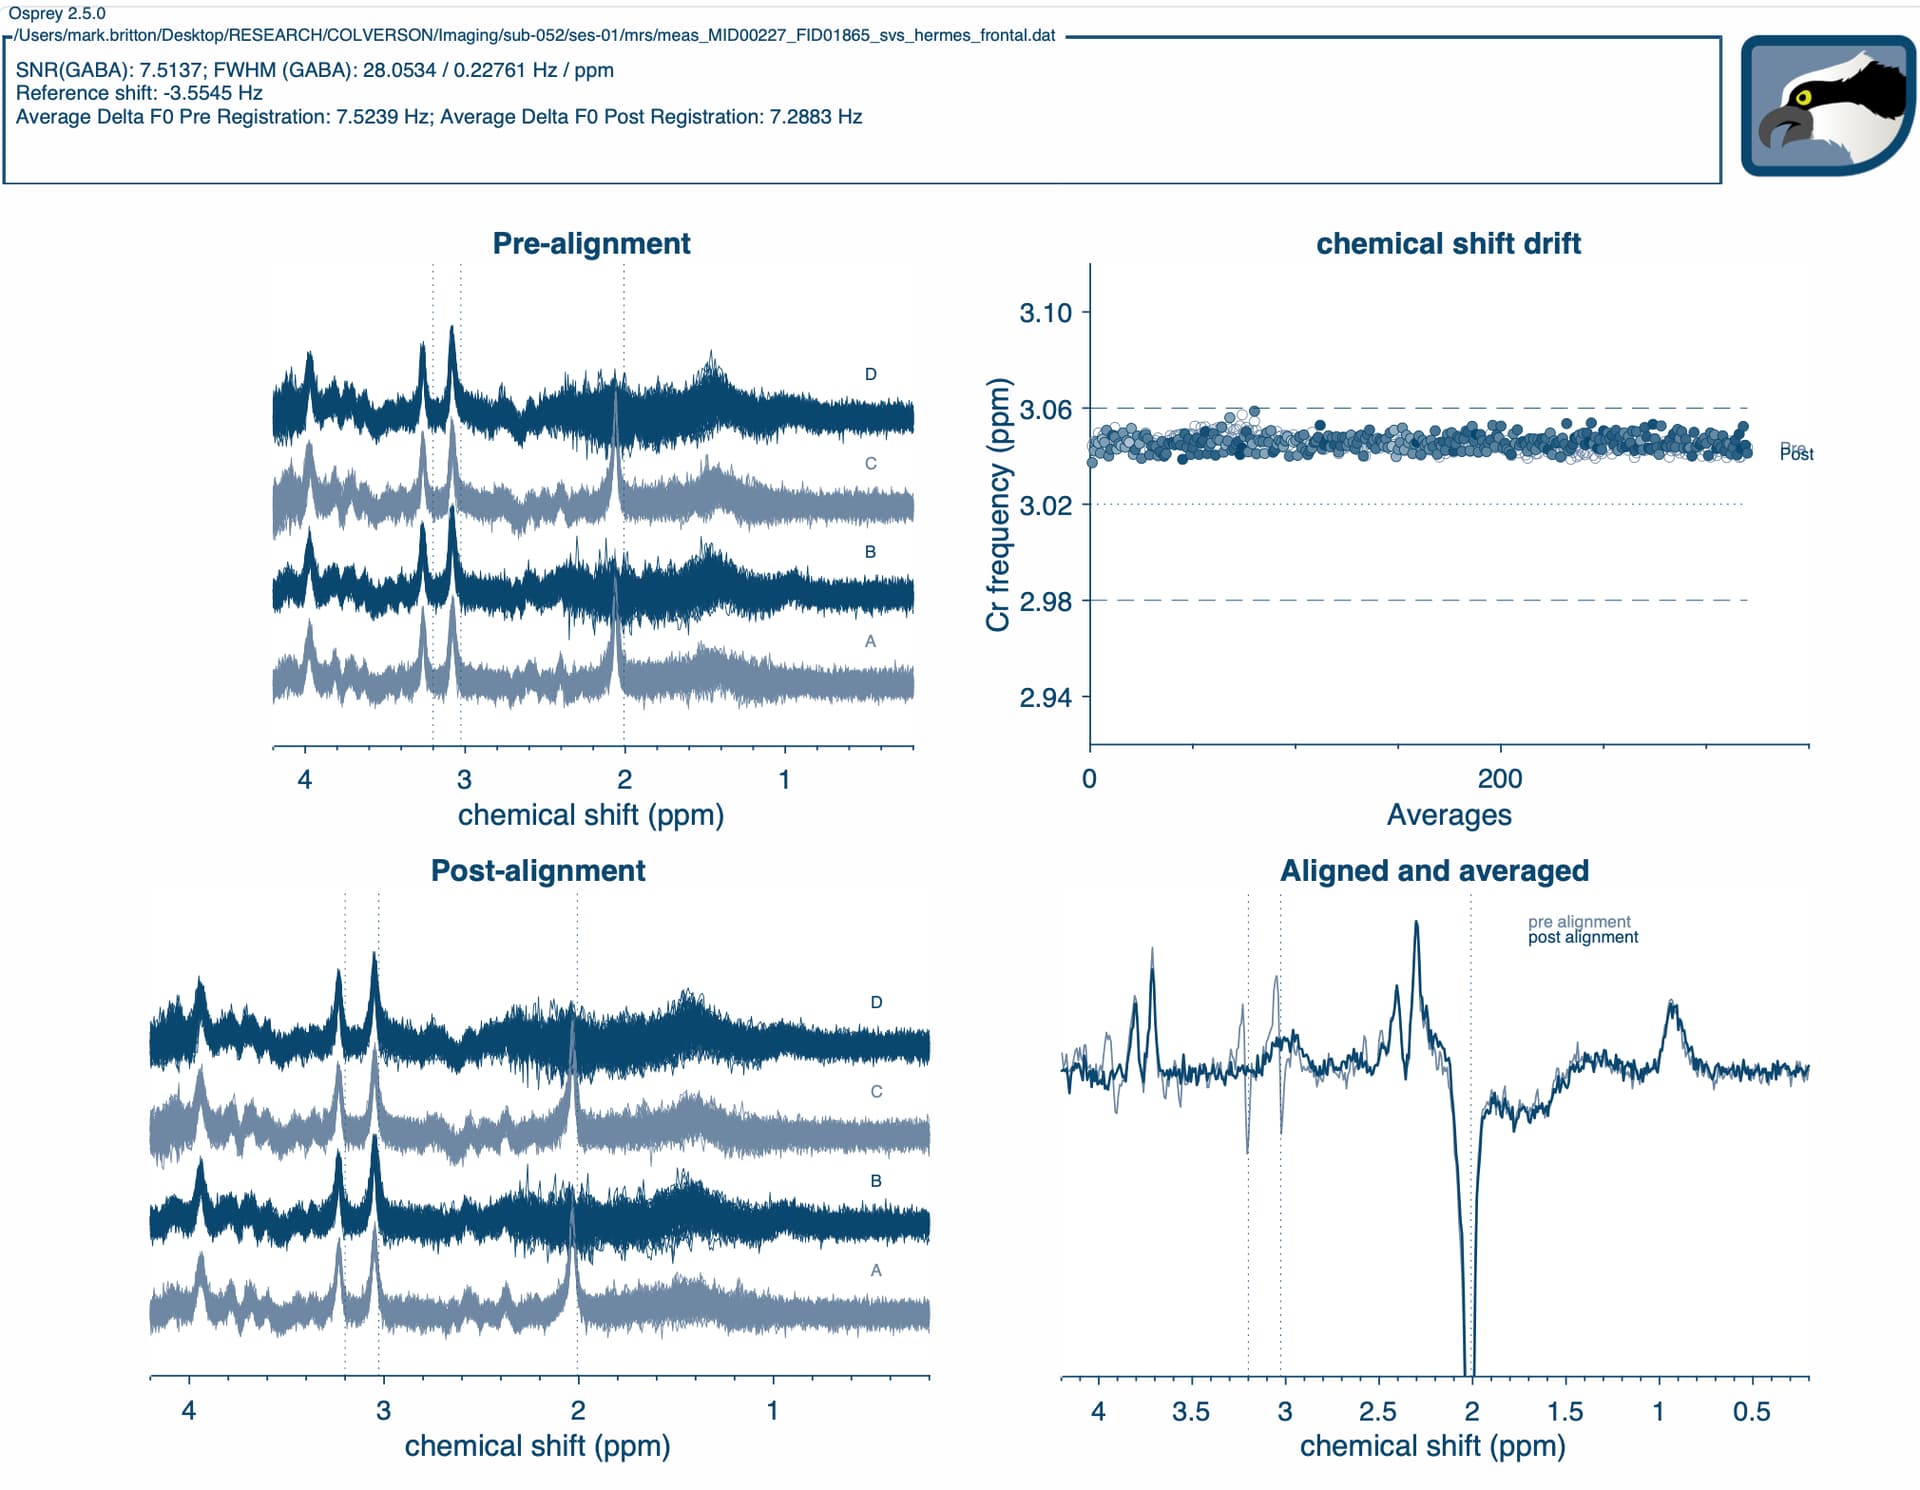
I’m noticing that our Cho, Cr, and NAA peaks in one of our HERMES datasets are pretty drastically misaligned for several participants. Please find below screenshots of OspreyProcess output for example participants.
Just to clarify, do you mean the shift in the left-hand panels? To my eye, it looks like the alignment between the individual transients and sub-spectra is good, there’s just an overall frequency shift in the data, which (I think) is coming from the initial frequency offset in your acquisition as shown in the top-right panel. However, this is removed in the fourth panel, so I think the data should be fine from the processing standpoint.
Also, in case it’s useful for future reference, the parameter “SubSpecAlignment” is used for alignment of the sub-spectra following spectral registration, which—as evidenced by the bottom-right plot—appears to be doing a decent job. The method to change the alignment procedure of the individual transients is prescribed by opts.SpecReg, which can be set to ‘ProbSpecReg’ or ‘RestrSpecReg’.
From a data processing perspective, I’d say yes. I believe there’s an overall frequency adjustment made for the compiled sub-spectra using the function osp_XReferencing, and I don’t think this is visible in the other three panels. (Worth double-checking in the modeling window, though)
However, this doesn’t correct the data completely. If the scanner was off resonance, then it would mean that the editing pulses applied during your HERMES scan were also off. This reduces the editing efficiency and therefore the signal amplitude of GABA/GSH etc. and we don’t correct for this in Osprey.
Thank you for the very comprehensive explanation! I will have a look at the function you reference to get a better sense of how it works/what it is doing.