I’m using a SVS MRS protocol on a SIEMENS 3.0T PRISMA to measure brain temperature (in other words MR Thermometry). For several weeks now I’ve been looking for an adequate software to do a relatively simple task i.e., I just need the positions/chemical shift of the water reference peak as well as the NAA peak to calculate temperature using a pre-established formula. However, I am yet to find a free software that gives me these values reliabily, as all of them seem to be focused on amplitudes and metabolite concentrations or post-processing. The closest I’ve gotten so far is with Tarquin, which allows me to see the raw water signal as well as the modified NAA peak on the same spectrum. However on Tarquin the NAA is consistently shifted to around 3.3 ppm rather than appearing around 2.0 ppm, giving me very unreliable temperature measurements. I’ve tried MRSCloud, MRSpa, FSL_MRS, and even the in-built SIEMENS spectroscopy software. jMRUI refuses to give us a license. So far, I am unable to visualize the water peak and NAA on the same spectrum with each peak in its appropriate location, as well as obtain any sort of reliable position information. Any insight/advice would be appreciated, no matter how simple! Thank you!
Of the software you mention, jMRUI would be a good option for what you’re trying to do – it already implements temperature estimation directly, is a bit more flexible in the modelling/reporting of discrete peaks, and gives more opportunity to inspect the data and the model (and adjust if necessary) at various steps along the way. I believe this tool was used by Thrippleton et al, 2014, with documented reliabilirty.
I believe this reports the shift parameter as epsilon in all_parameters.txt (and maybe in the html report) – although this would generally be a single shift for the entire model. If you are only interested in NAA, you could first split this off into a separate group, eg --metab_groups NAA+NAAG (see the documentation).
Sounds like the initial referencing has failed, or the dwell time is being mis-read. How does the rest of the spectrum look? Are you looking at in-vivo data?
A final suggestion would be to look at simple peak-fitting (eg, with FID-A op_peakFit), but you’d probably be better off taking the loading/preprocessing etc from an existing pipeline as above.
You are right, this isn’t the typical target output of most tools (including FSL-MRS), but we can certainly make it work with the standard interface by slightly modifying the command line inputs (as @alex mentioned). What do your spectra look like? Do you get a single spectrum with water and NAA clearly visible? Or are there two separate spectra?
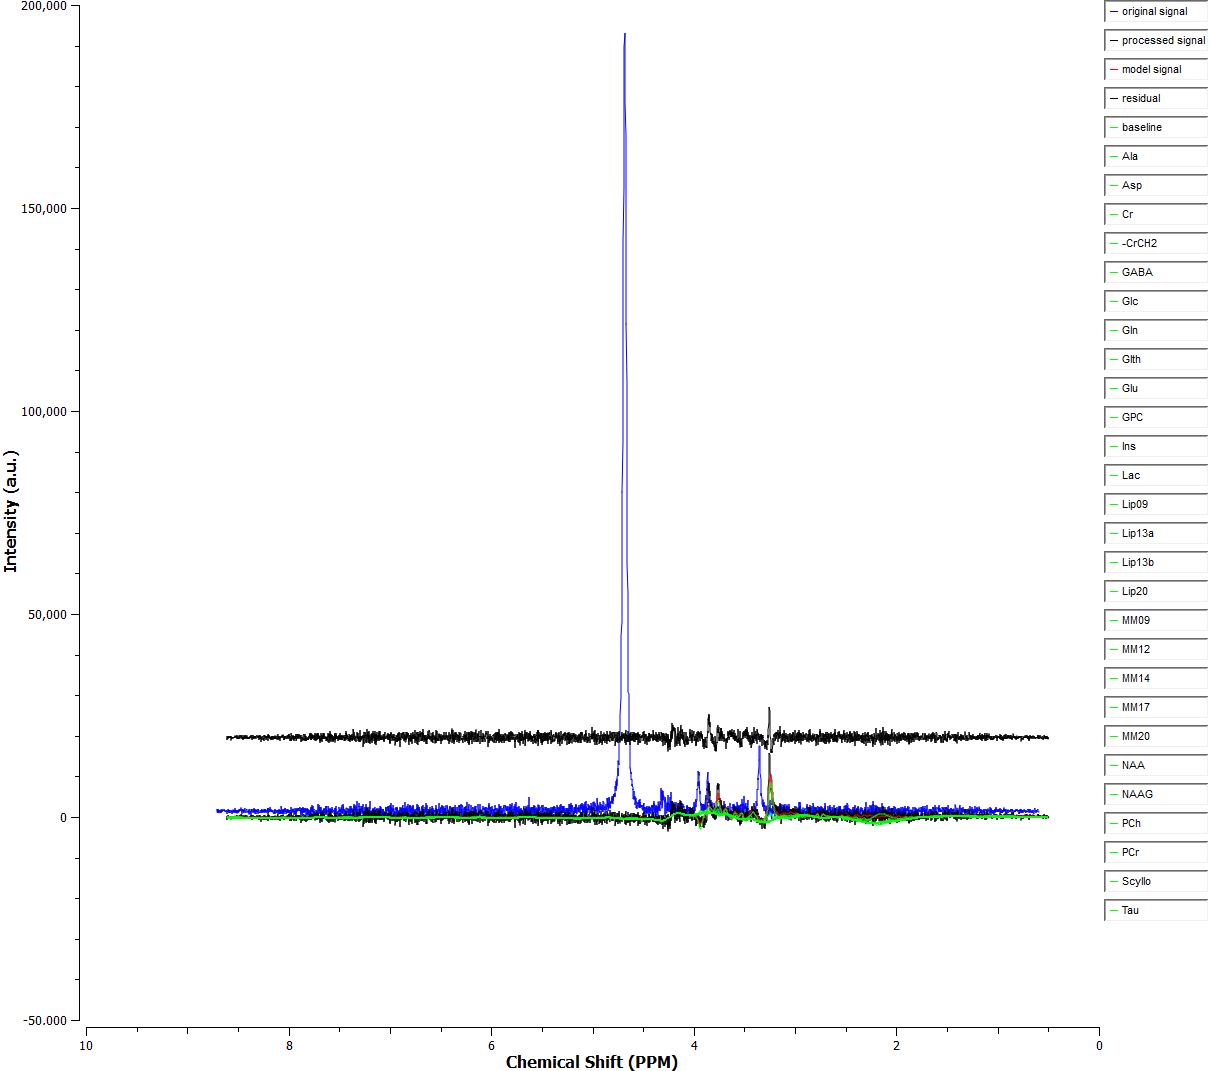
Thanks for your reply. Still waiting on the jMRUI license but glad to know it offers temperature estimation. I’ll try out that command line approach in FSL_MRS but I think I would still run into the problem of obtaining the position of the water peak - I’m assuming I can just take whatever value is given by the cursor in the GUI? An example Tarquin spectrum is attached below, and yes I’m using in-vivo data. The raw signal alone does allow me to visualize the water and NAA peaks clearly but as I said the NAA is shifted, and after pre/post-processing the water peak is removed from the spectrum.
It looks like the frequency scaling is off by (roughly) a factor of two in the Tarquin-loaded data. You could try using the --fs command line option (or equivalent in the GUI) to set the sampling frequency to match your sequence. Probably 2000 or 4000 (noting that Twix data is oversampled by a factor of 2).
You would need to include water in your basis set (there is inbuilt fitting of a reference water peak, but that won’t be suitable). If the basis doesn’t have water in, you could do this using the command basis_tools add_set --add_water --gamma 10 path/to/basis path/to/basis_with_water
Then set water and NAA and NAAG to have their own metabolite groups and widen the fitting range when calling fsl_mrs:
That should then fit the spectrum allowing water and tNAA to have their own independent shifts. There are other things that we can try if that isn’t quite right.
Sorry for the delayed reply, that seemed to do the trick! My raw signal (water suppressed, ECC corrected) looks much more accurate but I’m not sure if I can just take the ppm values given by the cursor for my calculations? I’d much rather use the values for the peaks estimated by the program (which I’m not quite sure how to obtain)
I was also wondering if anyone would know a way to get the jMRUI license faster? Both my supervisor and I have applied as well as asked again through the contact form but haven’t heard back. I think if it already implements temperature estimation we’d prefer to just go that route rather than rely on our own calculations from FSL or Tarquin.
Thanks for the offer, I’d really appreciate the help as I’m having some difficulties finding all the necessary parameters. How can I direct message you?