I am an undergraduate student working on an MRS processing project. I am currently exploring the creation of simulated data by manipulating a certain basis set.
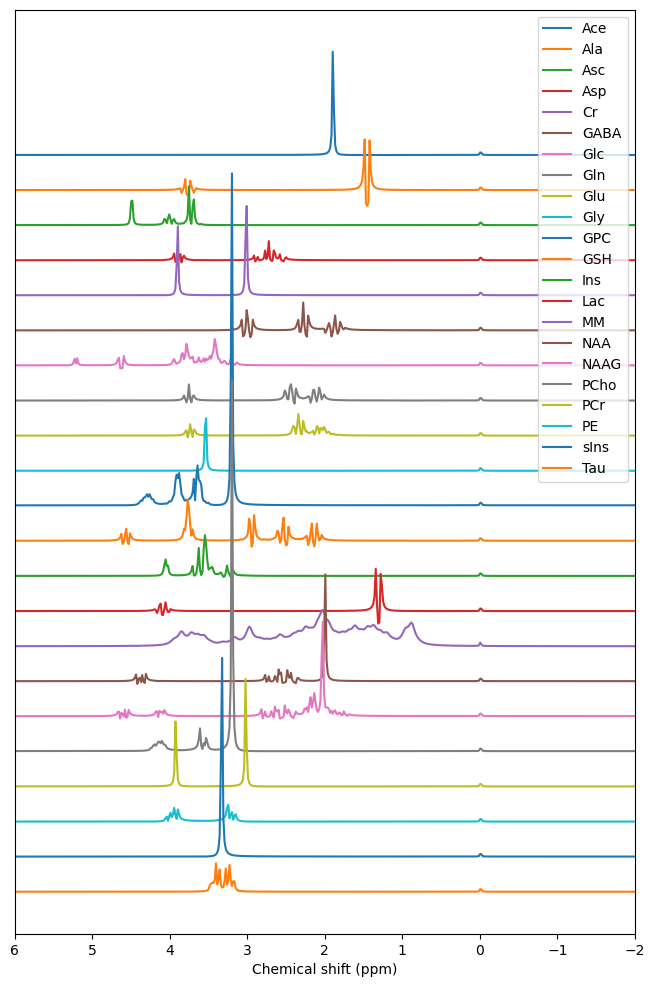
The basis set in question is the one provided by the 2016 ISMRM MRS Fitting Challenge. When plotting the real part of the individual metabolite spectra, I noticed that some components had negative values (as can be seen in the image below), even though they apparently have no phase shift in the FIDs. In addition, I noticed that all components have a small peak around 0 ppm.
I would like to know if negative values are possible in the real part of a basis set component spectra or if I would be doing something wrong when I apply the Fourier transform or when I load the basis set.
Depending on the echo time of the MRS acquisition, 1H MRS metabolite resonances can be negative in amplitude due to scalar coupling/evolution effects. While I’m unfamiliar with the specifics of the 2016 ISMRM MRS Fitting Challenge basis set, I imagine the spectra were simulated at TE = 30 or 35 ms. In this case, signals like GABA would show negative amplitudes. Excellent source texts to learn about scalar coupling/evolution can be found here and here.
I’m not sure why there is a peak at 0 ppm for every metabolite, but just to comment: 1H metabolite signals at ppm below zero are possible. The ppm scale was created to ensure that metabolite signals can be compared irrespective of magnet field strength (e.g., spectra acquired at 3T will be on the same ppm scale as those acquired at 7T). Traditionally the reference signal that is used to set the scale to 0 pm has been either TMS (tetramethyl-sliane [(CH3)4Si]) or DSS (2,2-dimethyl-2-silapentane-5-sulfonate) because of their electron shielding. Perhaps the basis set has somehow incorporated one of these signals. @gosia would be the person to reach out to about this.
Hi @marcioalmeida,
The negative values that you are referring to are indeed coming from J-evolution, which is taking place during echo time of 30 ms.
The 0 ppm peak was added to the spectrum of each metabolite as a reference mimicking TMS or DSS. Some software, e.g., LCModel, require a reference peak in the basis set.
Hope this clarifies things.
Best,
Gosia