Hi,
I am running Osprey on macOS (Apple Silicon M3) with MATLAB R2025a and all required toolboxes installed and up to date.
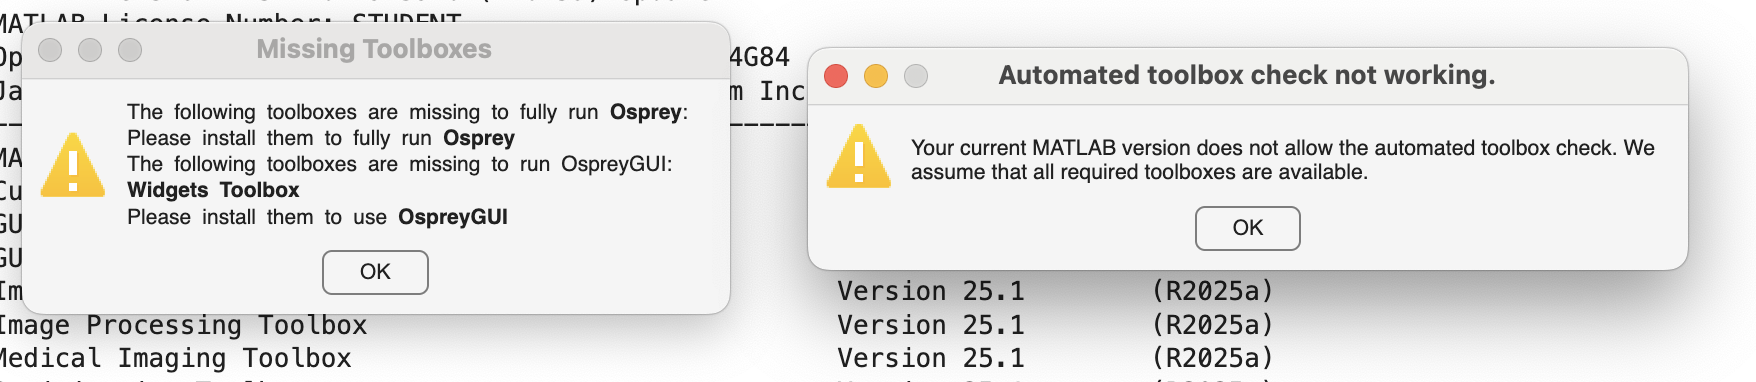
The GUI launches but I get two warnings, the Quantified tables render as raw HTML (rows/columns visible, but cells display <html>… / instead of formatted text).
I tried to run Osprey in two ways:
-
Full pipeline in MATLAB:
[MRSCont]=OspreyJob(‘/Users/…/jobSDAT_MEGA.m’);
[MRSCont] = OspreyLoad(MRSCont);
[MRSCont] = OspreyProcess(MRSCont);
[MRSCont] = OspreyFit(MRSCont);
[MRSCont] = OspreyCoreg(MRSCont);
[MRSCont] = OspreySeg(MRSCont);
[MRSCont] = OspreyQuantify(MRSCont);
[MRSCont] = OspreyOverview(MRSCont); -
Or run directly via GUI.
Troubleshooting already tried:
Reinstalled GUI Layout Toolbox and Widgets Toolbox Compatibility Support
Cleared MATLAB path (restoredefaultpath) and re-added Osprey, SPM25, GLT
Is this a known rendering issue on macOS?
Is there a fix/workaround to display the tables correctly?
I attached a screenshot to show you exactly what I got.
I will be happy to provide you with any additional information you may need.
Thank you!
MATLAB info:
Operating System: macOS Version: 15.6 Build: 24G84
Java Version: Java 11.0.23+9-LTS with Amazon.com Inc. OpenJDK 64-Bit Server VM mixed mode
MATLAB Version 25.1 (R2025a)
Curve Fitting Toolbox Version 25.1 (R2025a)
GUI Layout Toolbox Version 2.4.1 (R2024b)
Image Acquisition Toolbox Version 25.1 (R2025a)
Image Processing Toolbox Version 25.1 (R2025a)
Medical Imaging Toolbox Version 25.1 (R2025a)
Optimization Toolbox Version 25.1 (R2025a)
Signal Processing Toolbox Version 25.1 (R2025a)
Statistical Parametric Mapping Version 25.01.02 (SPM25)
Statistics and Machine Learning Toolbox Version 25.1 (R2025a)
Widgets Toolbox - Compatibility Support Version 1.5.1 (R2023a)