Hello,
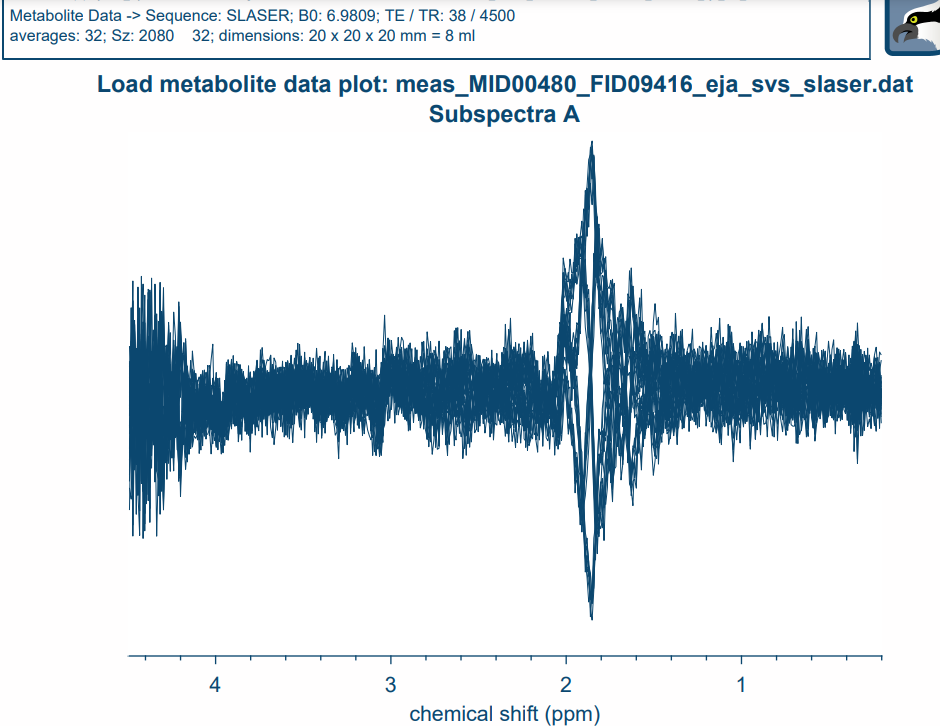
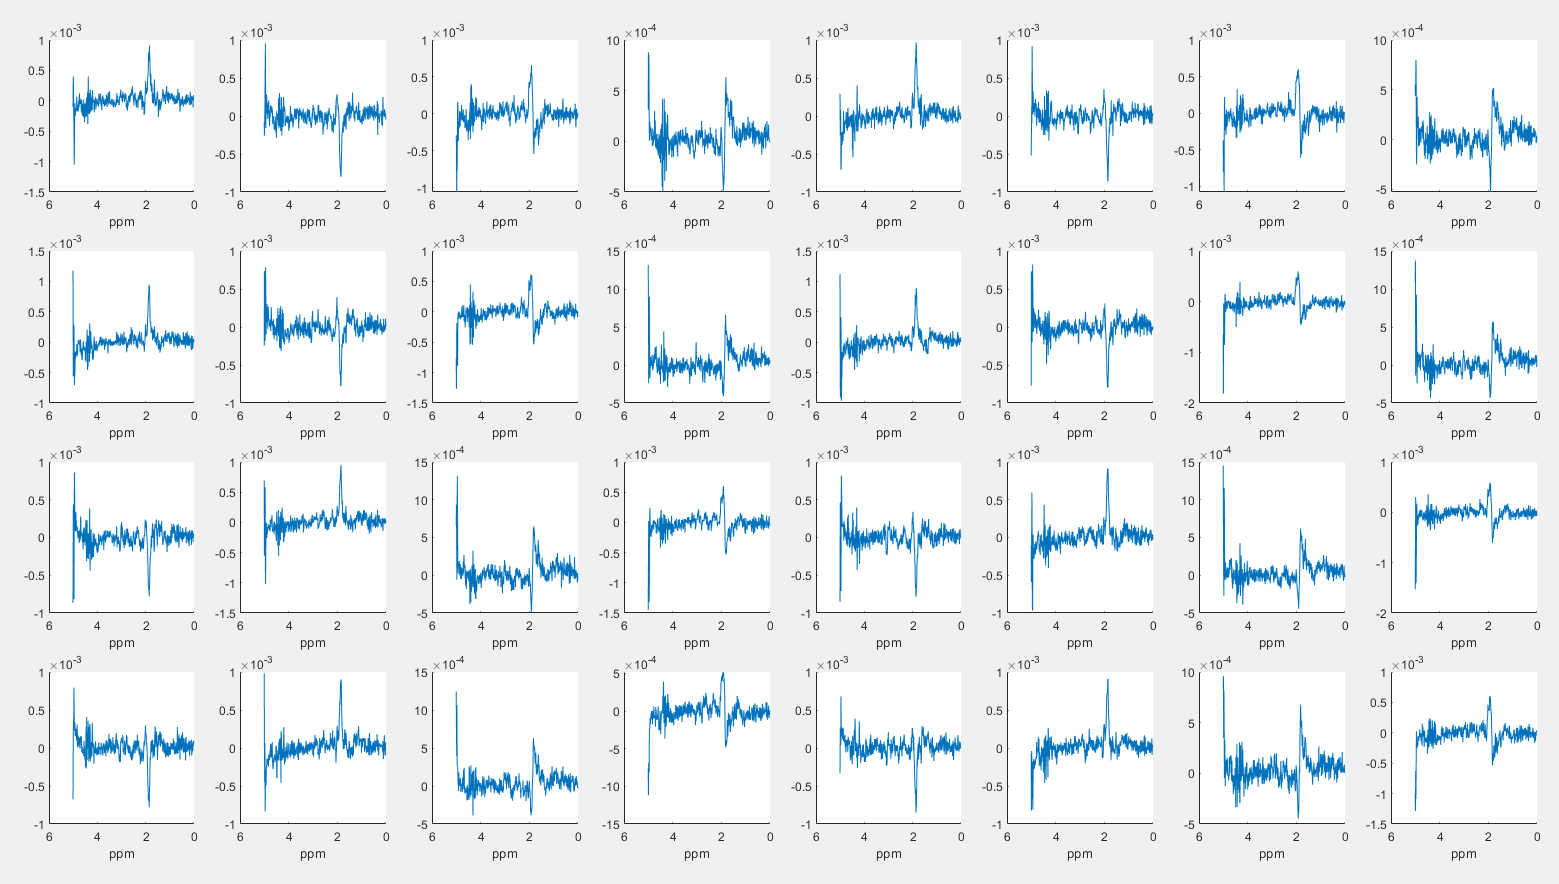
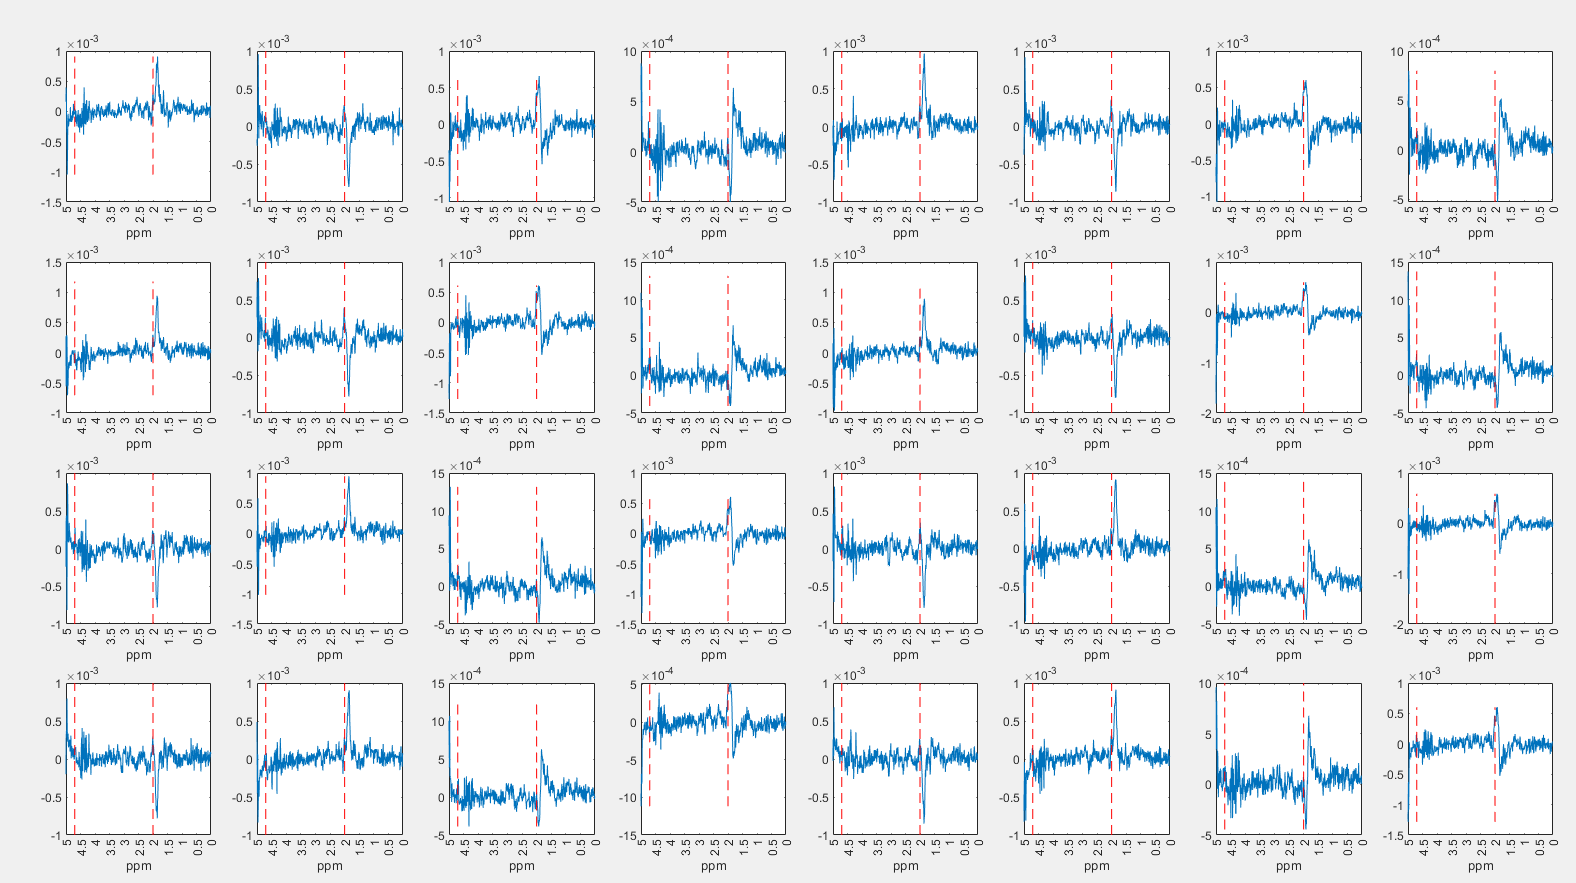
I’m trying to process twix data collected by a semi-laser sequence on a Siemens 7T scanner, but after loading the data, the specttras looked weird that the lines corssed aournd 2 ppm and tried to process directly, the corrected sprectas are still looks weird. I ploted every individual spectra and it looks like the peaks around 2 ppm are really different, I wonder wheter this is some kind of phase problem and if you have any suggestions to deal with this kind of data?
Upon examining the semi-LASER SV spectrum, it appears to be considerably noisy. Given this situation, I suggest taking several factors into consideration. These include performing PRESS (or STEAM) SVS and spectrum comparisons, verifying the normal operation of the sequence, checking the condition of the Tx/Rx coil, and investigating any abnormalities in the algorithm or code related to channel combination. It would be beneficial if you could provide the protocol information and raw data (in Twix file format) utilized during the scanning process, as this would enable us to seek assistance from MRS experts. I am hopeful that this matter will be resolved promptly.
What kind of acquisition is this? I first thought I’d be looking at a poorly shimmed proton brain spectrum but there’s just not a lot else going on in the spectrum - is this 31P?
Hi Knam and Georg,
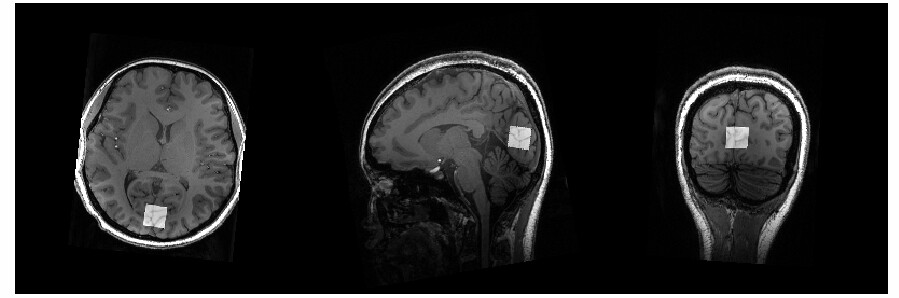
Thank you for the reply. It is a 1H acquitision at the occipital lobe, we used following parameters during the acquisition:
TR =4500 ms, TEs =38ms, 32 averages, bandwidth =3000 Hz, data points =1024, 90 ̊ excitation pulse with duration =3.4 ms and 180 ̊ refocusing pulses with duration =5ms. The spoiler gradients had an amplitude of 25 mT/m and duration 0.8ms.
Hi Chuyue,
like Georg I also have the problem to see a real 1H spectrum (e.g. the two peaks at around 3ppm are too close together for choline and creatine). Have you looked at the water peak position and the rest of the spectrum that it’s right scaled etc.?
If the peaks around 2ppm were at lower values, I would have said that something went wrong with fat suppression at the skull.
Gosia from CMRR might help you to adjust the crusher gradients. You can also play with voxel placement. This sequence has been tested many time for different brain locations, it should work you need right parameters from CMRR and better VOI placement.
Hi Heiner and Uzay,
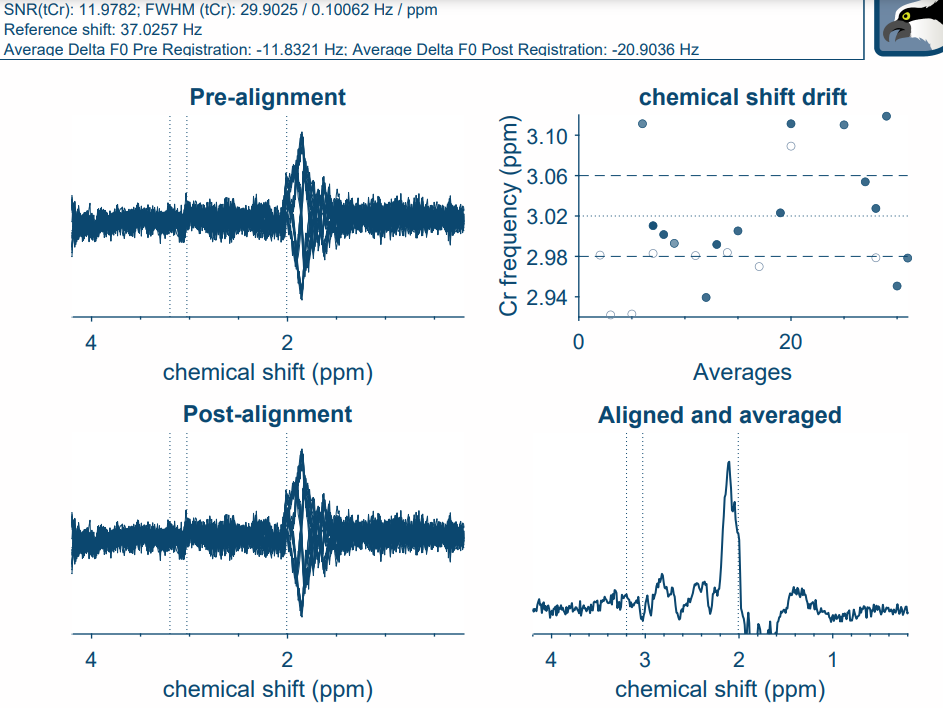
Thank you for the reply, I checked the individual spectra it there is a little shift of peak near 2.0 ppm to 0 ppm direction and we will try to optimize the scanning protocol and VOI placement.
Hi,
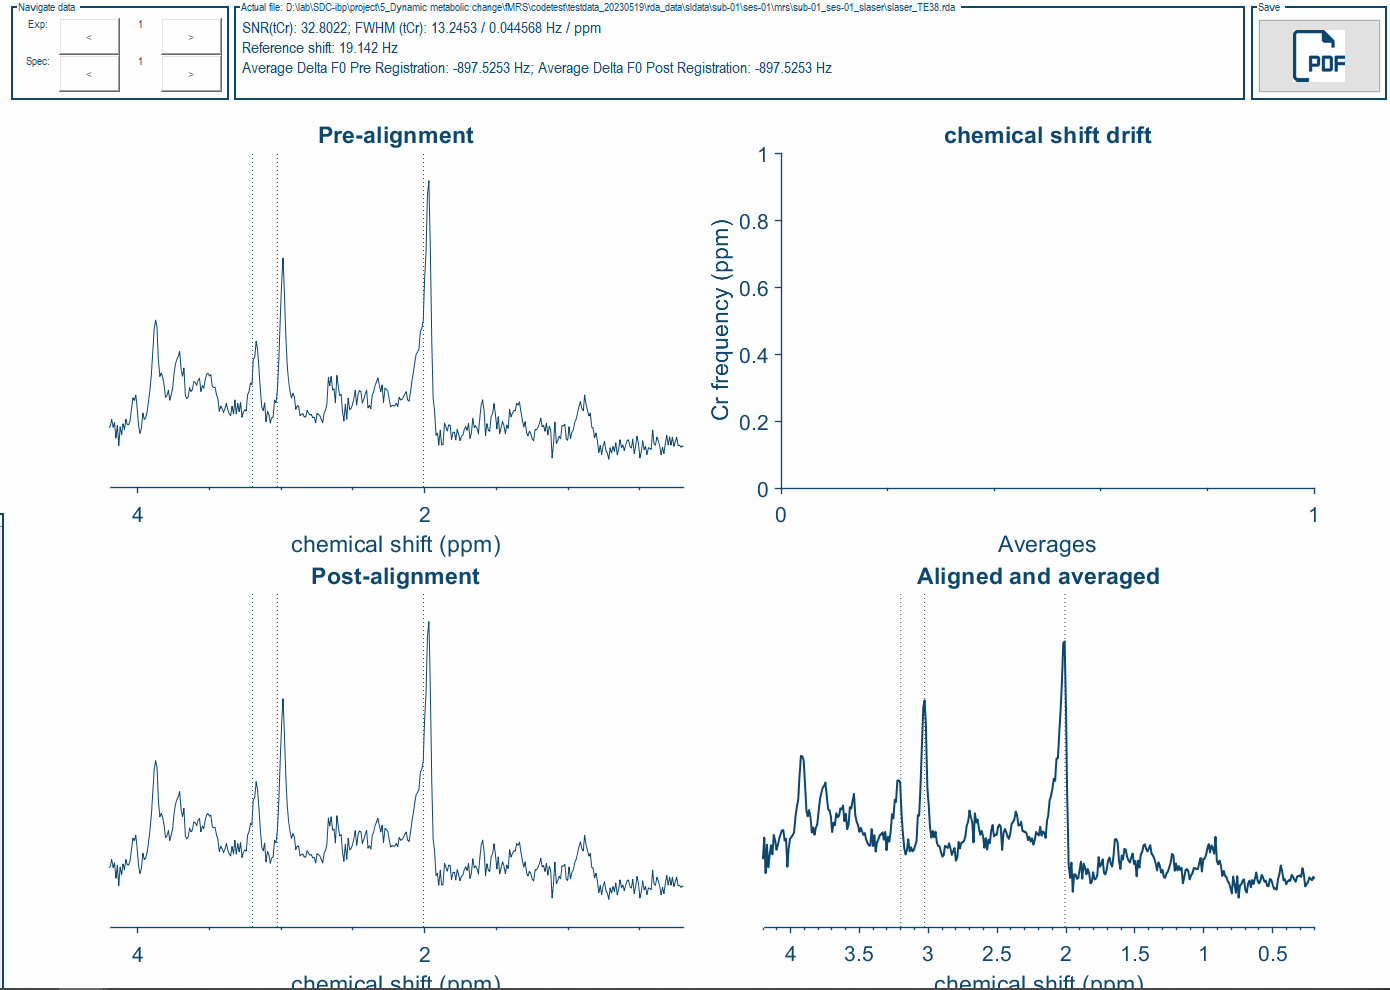
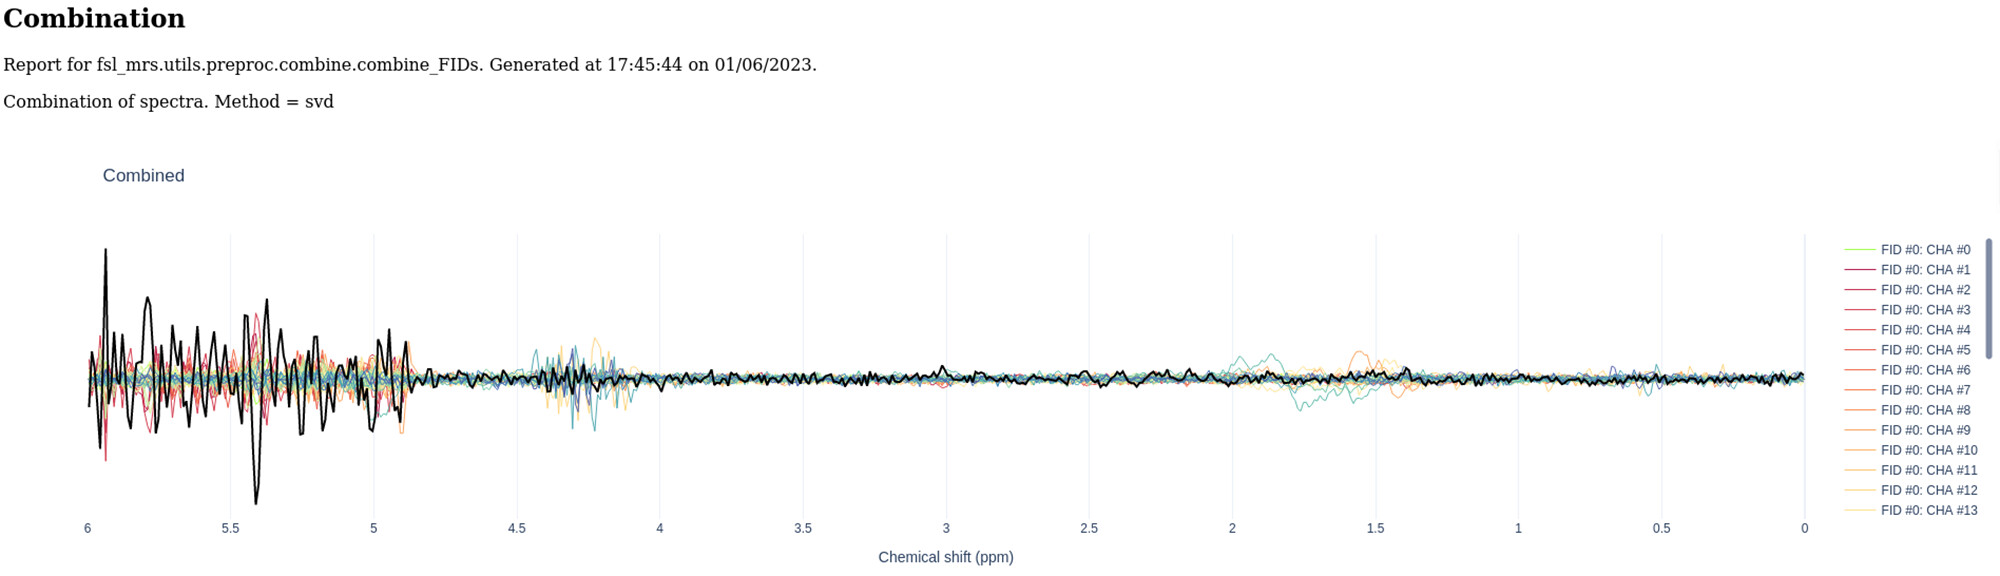
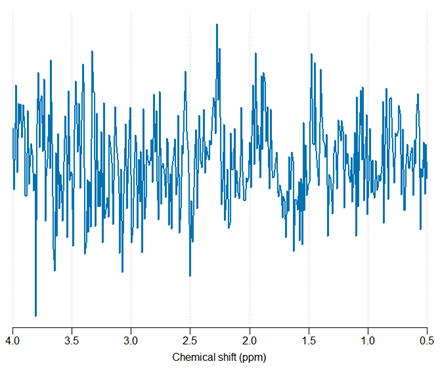
I tried to use .rda format file of same aquisition exproted from the scanner, and the spectra looks better. I also tried load the twix data with FSL-MRS and spant, but the spectra also looked wired. I guess there is something wrong of the twix data or during the coil combination.
Best,
Chuyue
Yes, the RDA data looks a lot better, and you could certainly analyze it. Do you have a water-unsuppressed acquisition from the same voxel? It’s possible that the determination of the phase and the amplitude weightings during the coil combination doesn’t work as well with data as noisy as this.
We chose send reference image option during scanning, but there is only water reference images in .rda or .ima format, not twix format. I load water reference data only when load the .rda format metbolic data. And the .rda data is averaged data on the scanner, we looked every single scan on the, the spectra is still looked wired.