Hello!
Currently I have Gannet running smoothly.
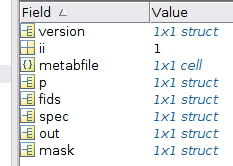
I am saving the matlab output file
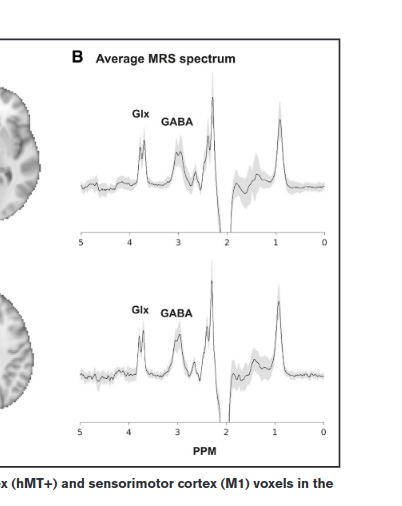
Where would I find the final output spectra, so that I could create something like this:
From DOI: 10.1161/STROKEAHA.123.043269
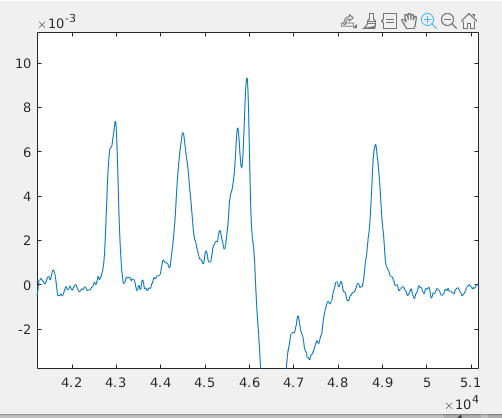
Oh I’m getting somewhere:
plot(real(MRS.spec.vox1.GABAGlx.diff))
If this is what I should be doing, my next questions would be:
How do I get this in ppm?
admin
October 20, 2023, 7:56pm
4
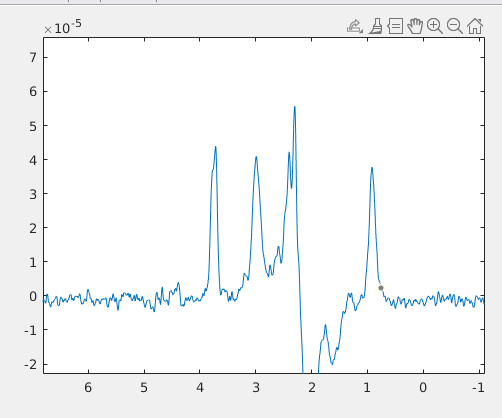
Oh yes! That helps me get the ppm!
but do I use .diff or _scaled.diff? Or something else?
For anyone else who might stumble on this in the future:
plot(MRS.spec.freq,real(MRS.spec.vox1.GABAGlx.diff_scaled))
set(gca, 'XDir','reverse')
produces:
1 Like
Hi @weberam2 ,
The PaperPlot.m function in Gannet is a wrapper function allowing you to plot the spectral results at publication-level quality. Just type help PaperPlot for full usage instructions.
Mark
3 Likes