Hello everyone,
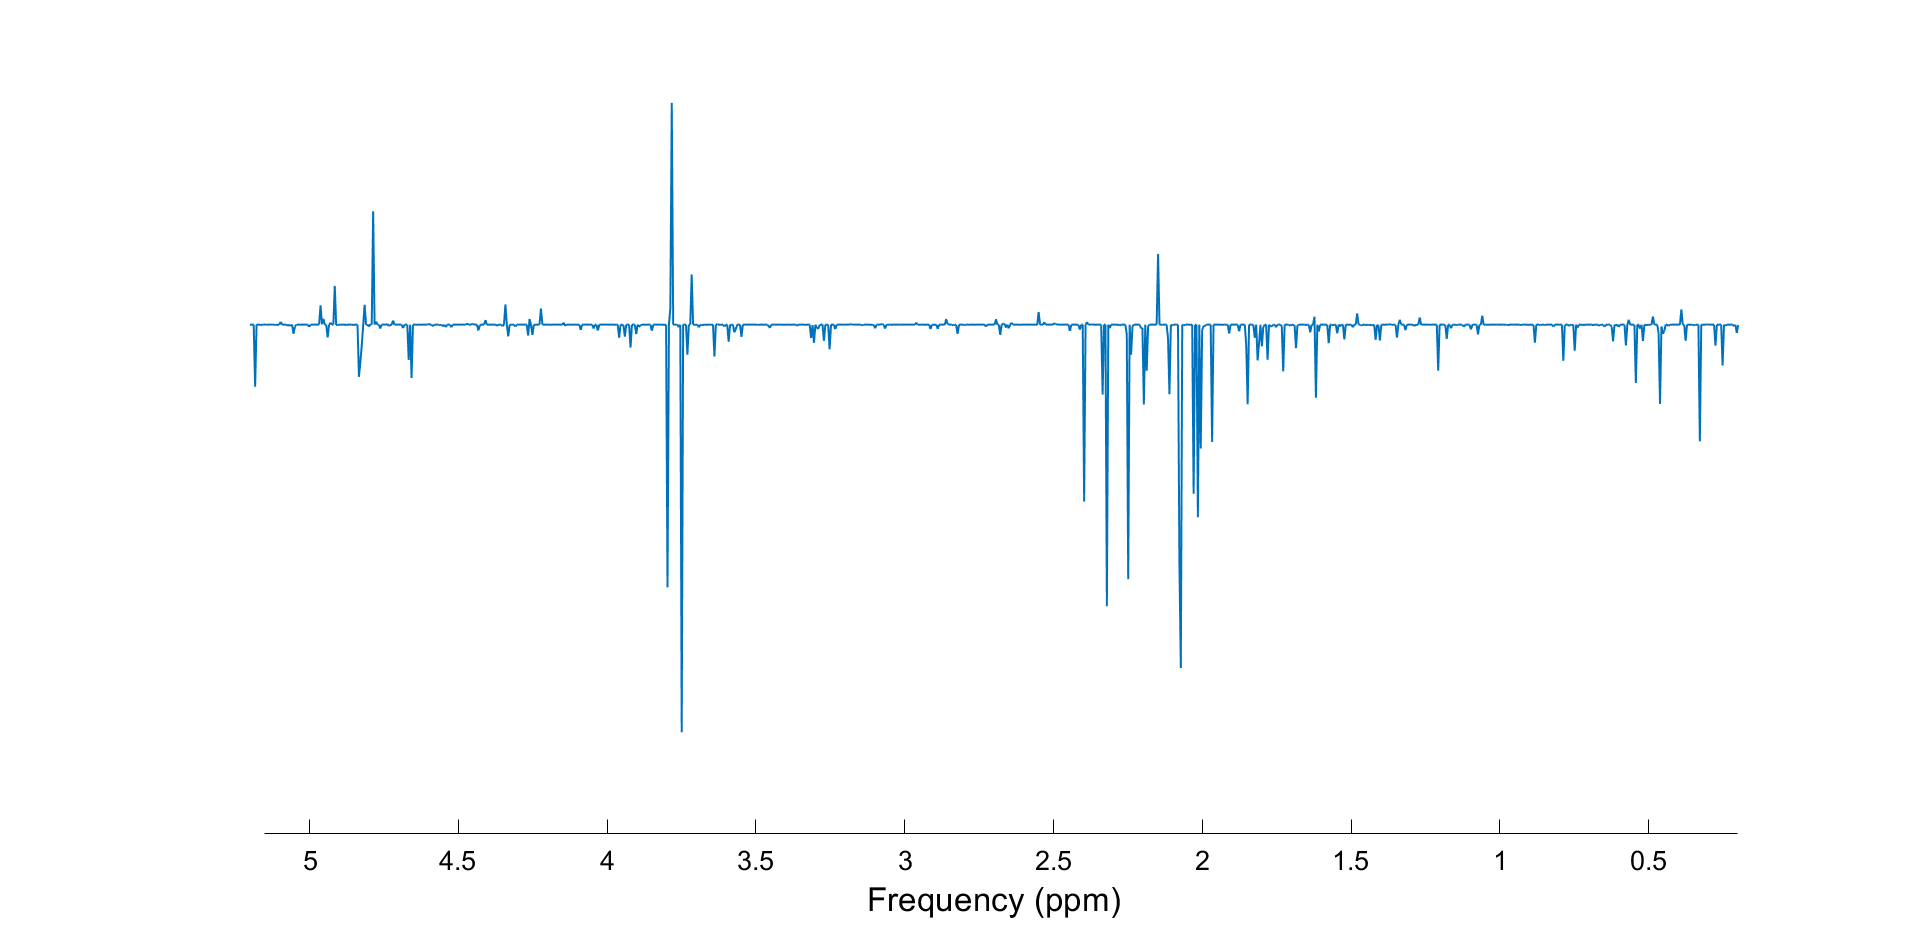
when I use the io_readlcmraw_basis function from FID-A to read LCModel basis and plot the spectra using the op_plotspec function, I obtain the following spectrum for Glu, and the same issue occurs with other molecules. Is there anyone who knows what could be the problem here?
Yes - you are trying to read the asis set from the LCModel website, right? These are, for a weird inexplicable reason, encrypted (You can validate that it’s encrypted if it has a negative BADELT entry).
We have a version of op_plotspec in Osprey that breaks this encryption (which was possible after Provencher released the LCModel source code); you can find it behind this link. Note that our FID-A version reverses the fft sense and the frequency/ppm axes and is therefore not compatible with native FID-A (see also FID-A simmulation code - Data Processing - MRSHub Forum); you’ll need to only have one version in your MATLAB path.
Generally, I would strongly recommend to not use the basis sets provided on the LCModel website. They are based on phantom acquisitions (not simulations) and no one knows the exact acquisition parameters, so they will likely not be a good match for your sequence.
Thanks for your reply and advice !
Yes, I am trying to read the basis from the LCModel’s official website. I will try the simulated basis sets !
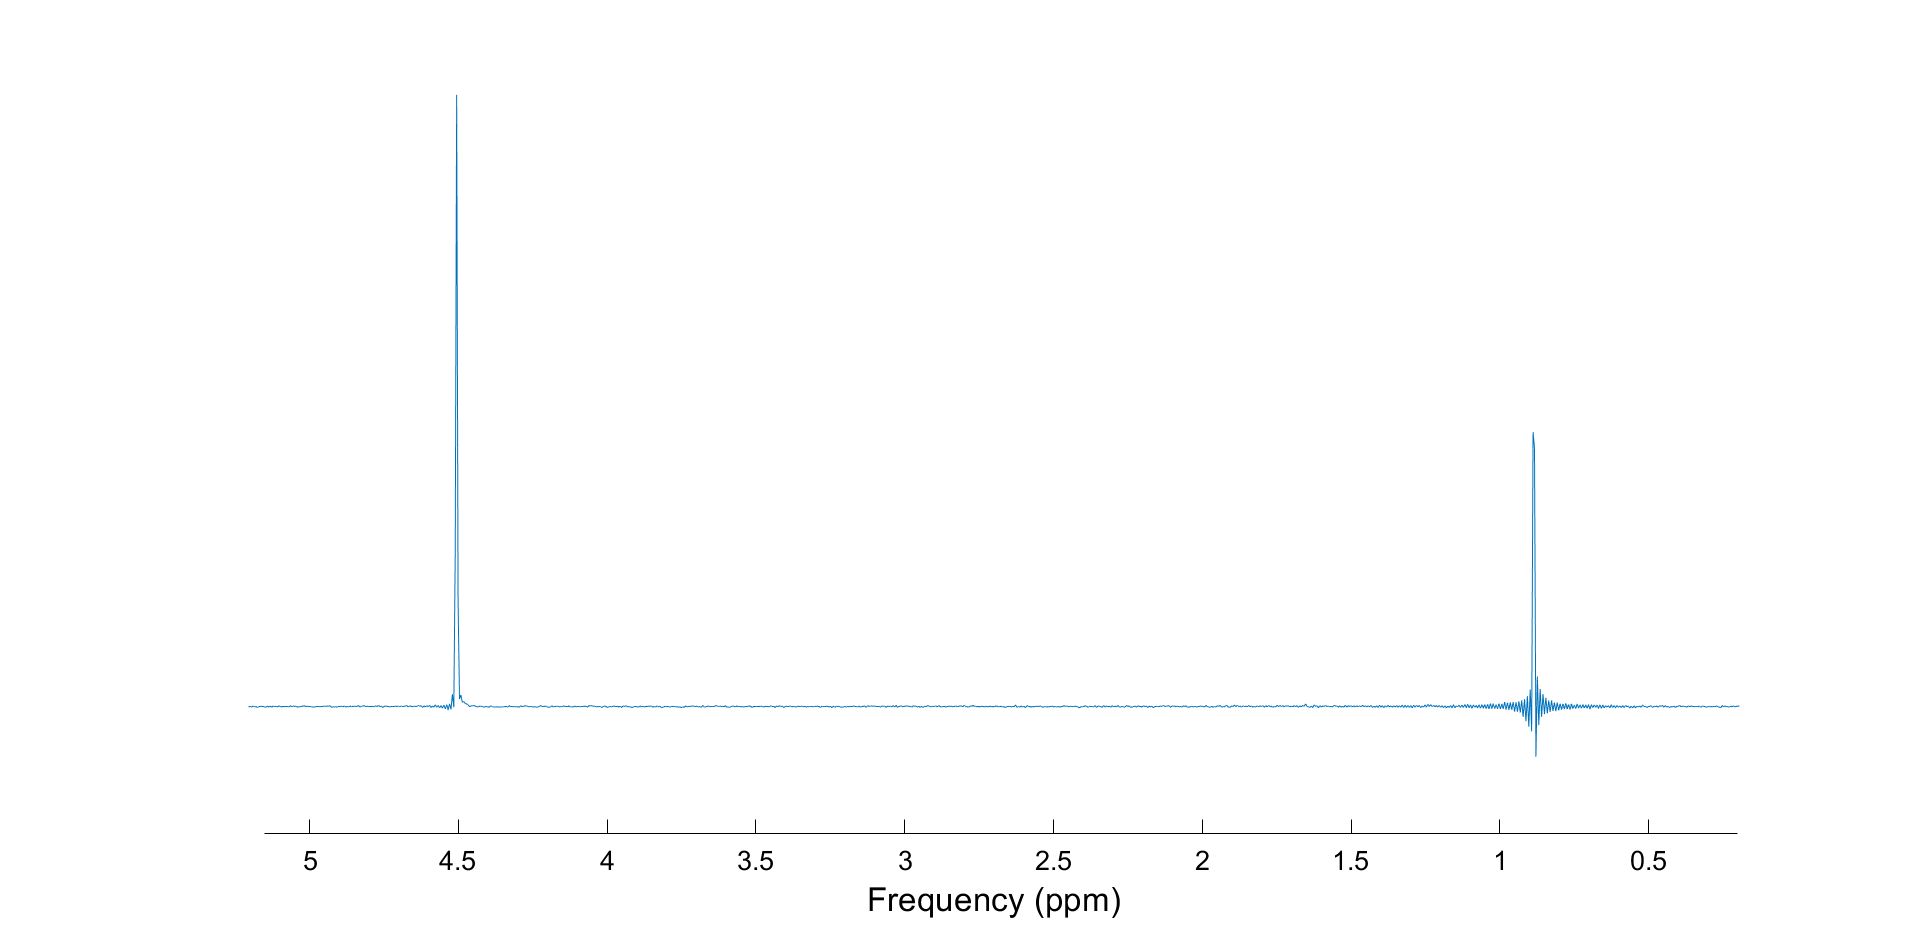
I’m curious to see what the basis spectra of LCModel be like. So I have downloaded the new version of Osprey from the link you provided, and the Metlab’s path only includes Osprey (without FID-A).
When plotting the peak for Glu, I only see two sets of singlets at 4.5 ppm and 0.89 ppm separately, and the same applies to other molecules.It seems different from the actual molecular spectrum. I’m not sure what caused this.