Hi Georg, @admin
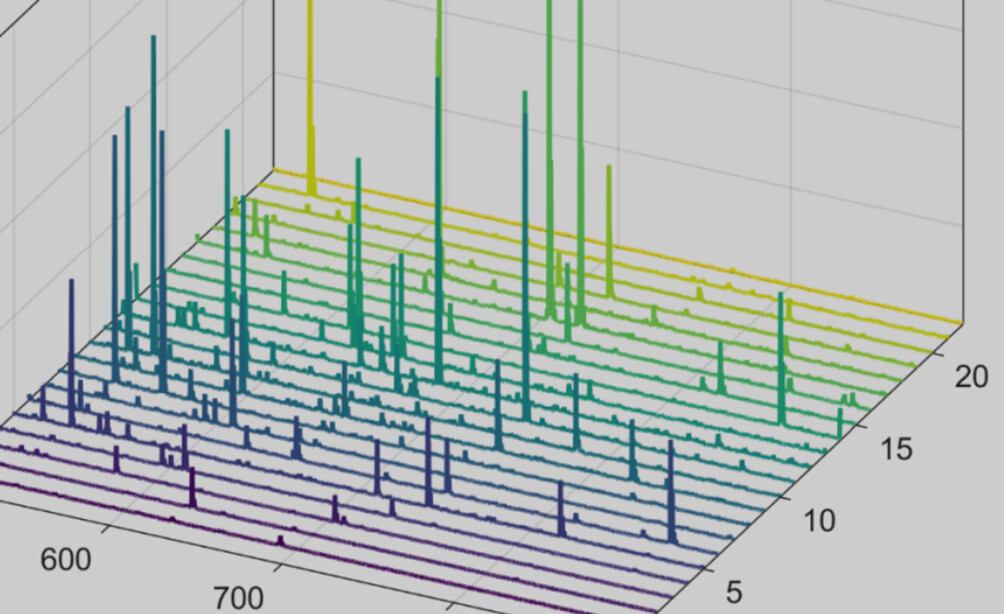
As you know, the LCModel output only shows a single spectrum. Recently I wanted to use the results I got from LCModel to show multiple spectra in my Figure at the same time.(Similar to the following images):
Yes, this is the same data LCModel uses to create its plots, and the only way I’m aware of to achieve what you want. There are a few MATLAB functions out there which can read this data as a starting point, including:
These may need some adaption depending on your exact purpose – eg, if you hope to extract individual metabolite fits (NEACH>0 in the LCModel config), my Python implementation would need to be extended; unsure about the other implementations.
The vertical scaling may be somewhat arbitrary, depending on your acquisition and any preprocessing – depending on context, you might wish to consider some sort of normalization.
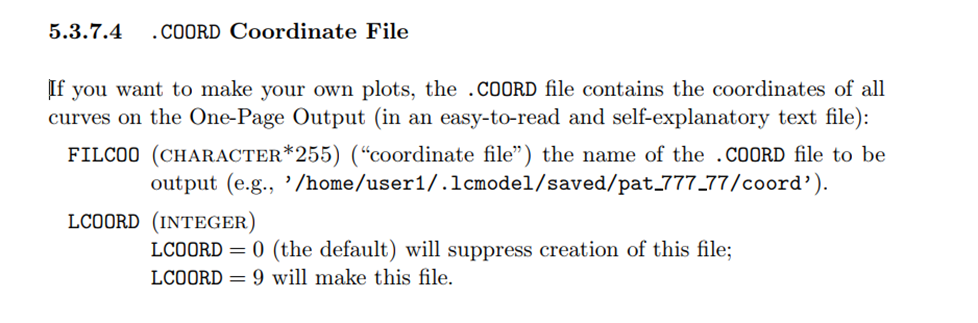
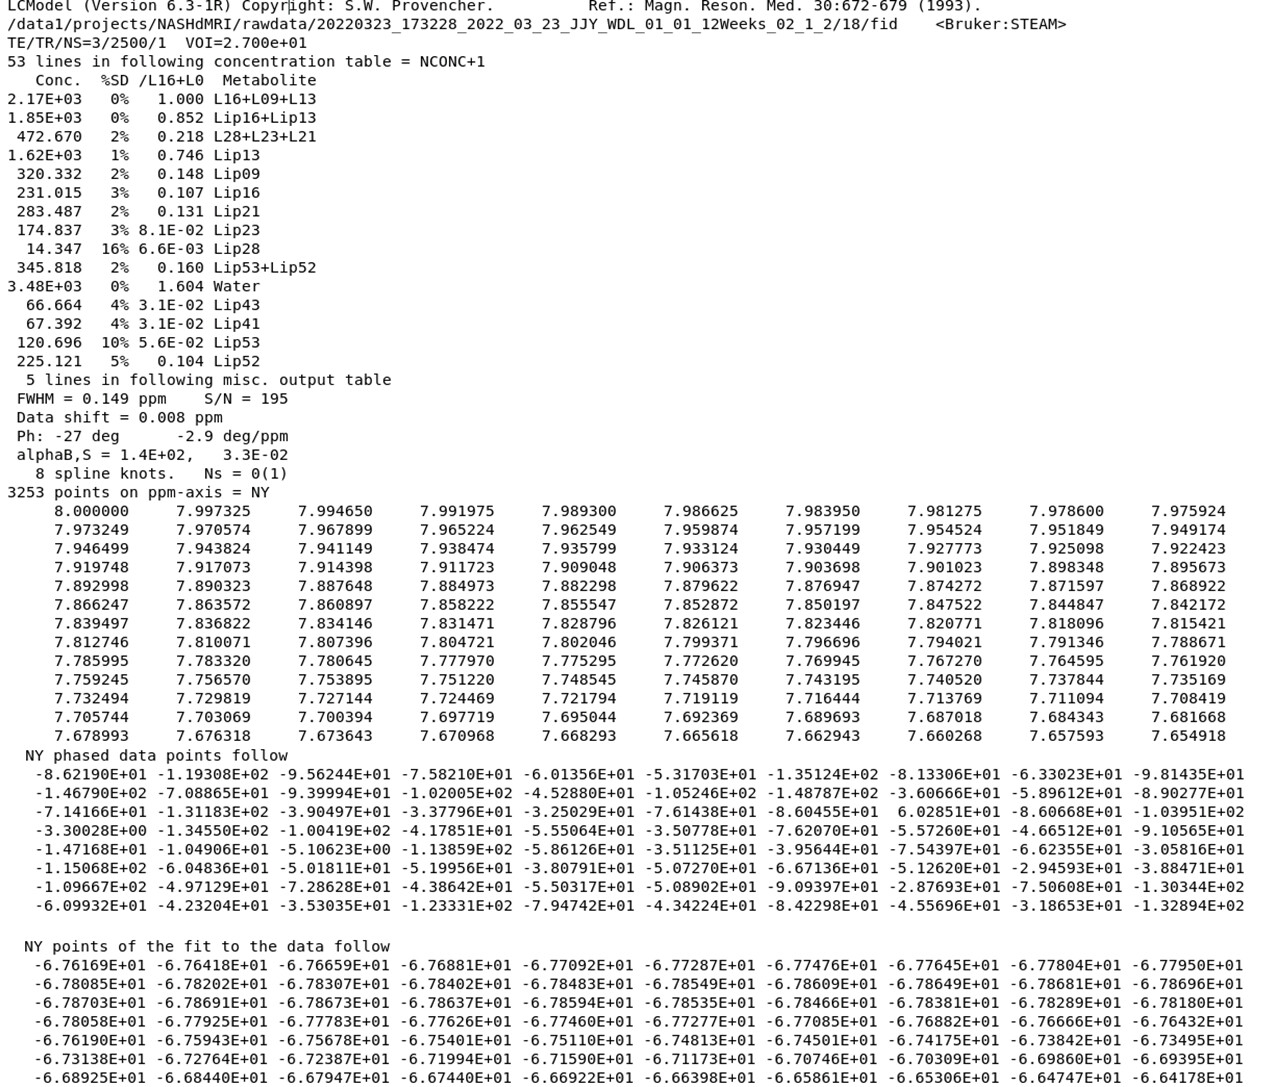
As @alex says correctly, we have a nice little function that reads concentrations, fits, individual metabolite signals etc. from the .table and .coord files.
It’s currently a little buried inside osprey/osp_fitUnEdited.m at develop · schorschinho/osprey · GitHub, but you should be able to take the readLCMFitParams sub-function out of there and tailor it to your needs. If you need a standalone version, let me know and I can probably make that happen.
@alex’s python function was helpful for me, and I extended it to also read in the individual metabolite spectra and plot them, the original data, the model fit, and the residual. Hopefully it’s helpful for someone in the future.