Hi @Helge@admin
I had some problems when I tried to use VESPA to generate a .raw file to generate the basis set. First I used vespa simulations to generate .RAW files of metabolites such as NAA, and everything seemed to work fine in vespa.
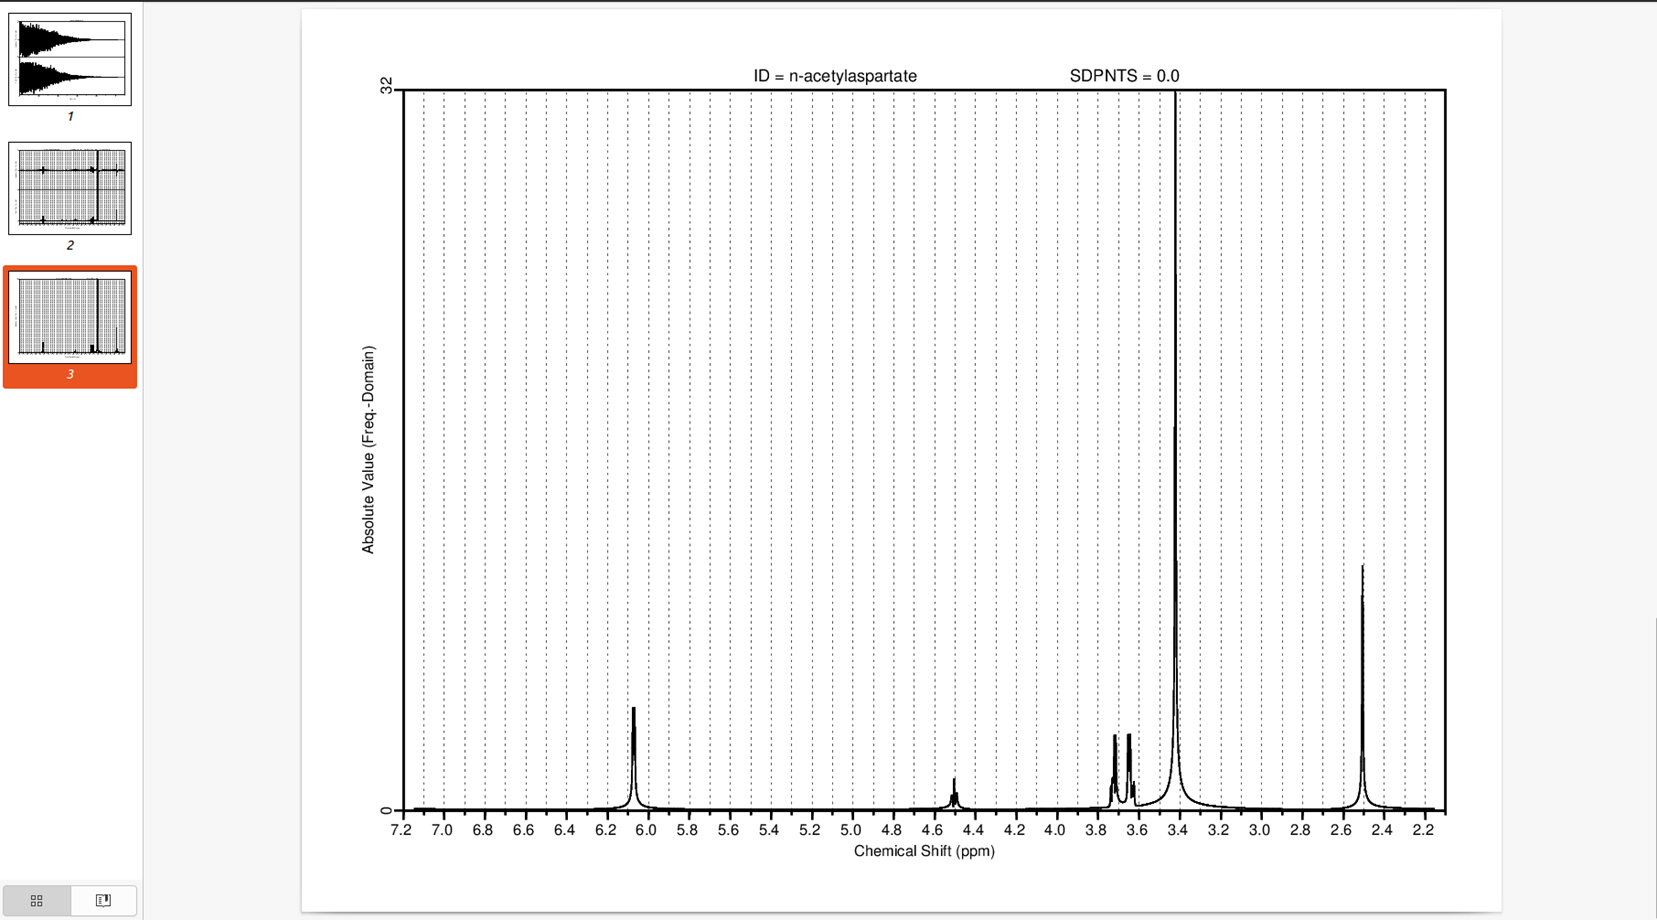
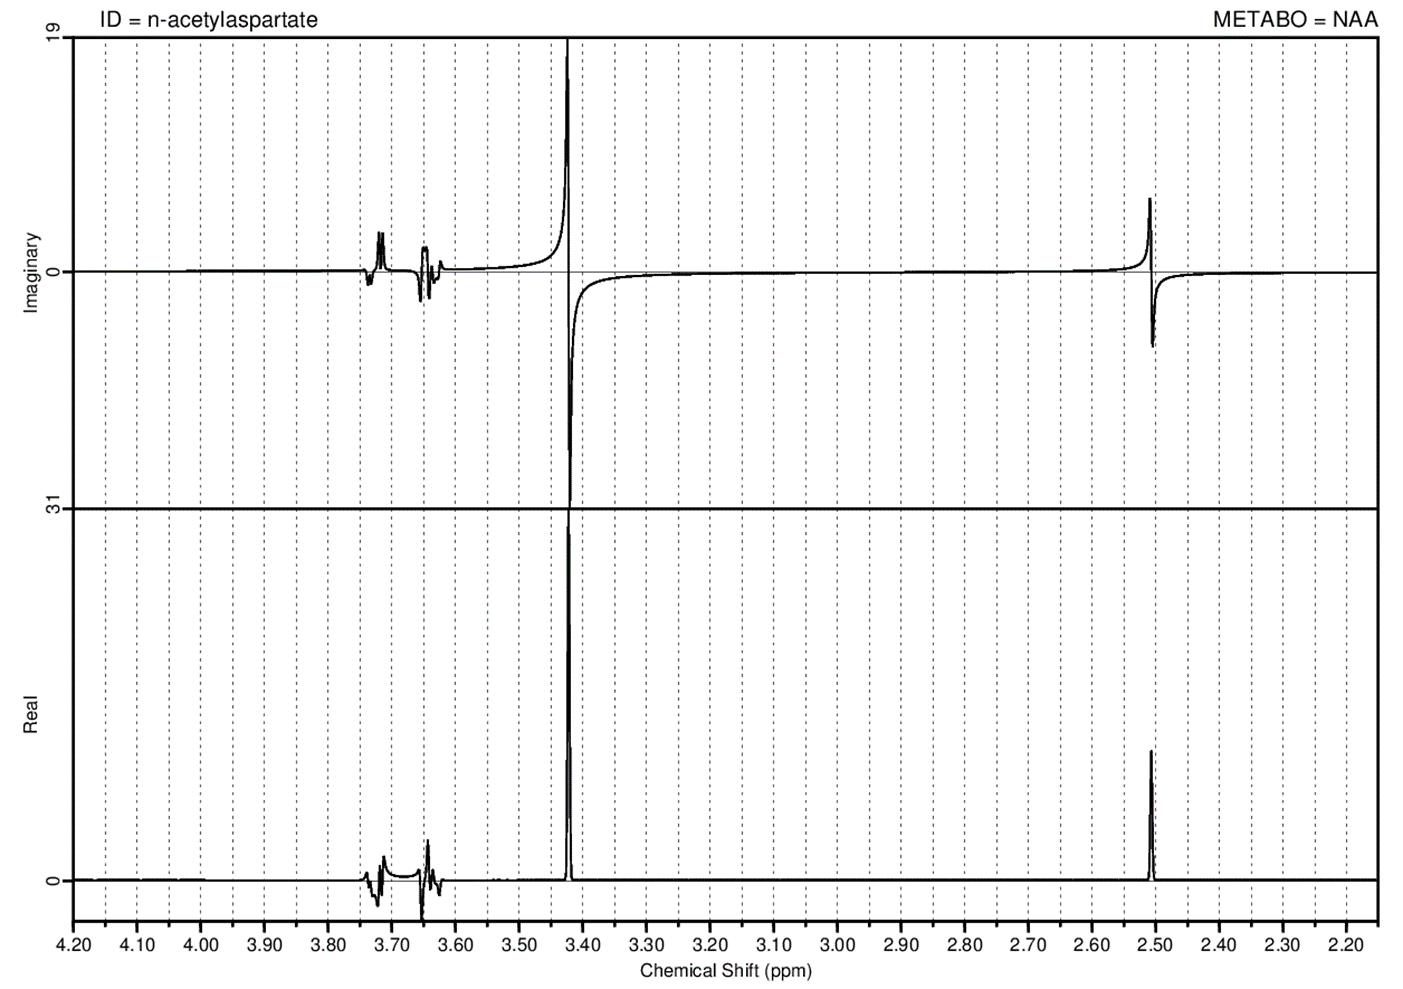
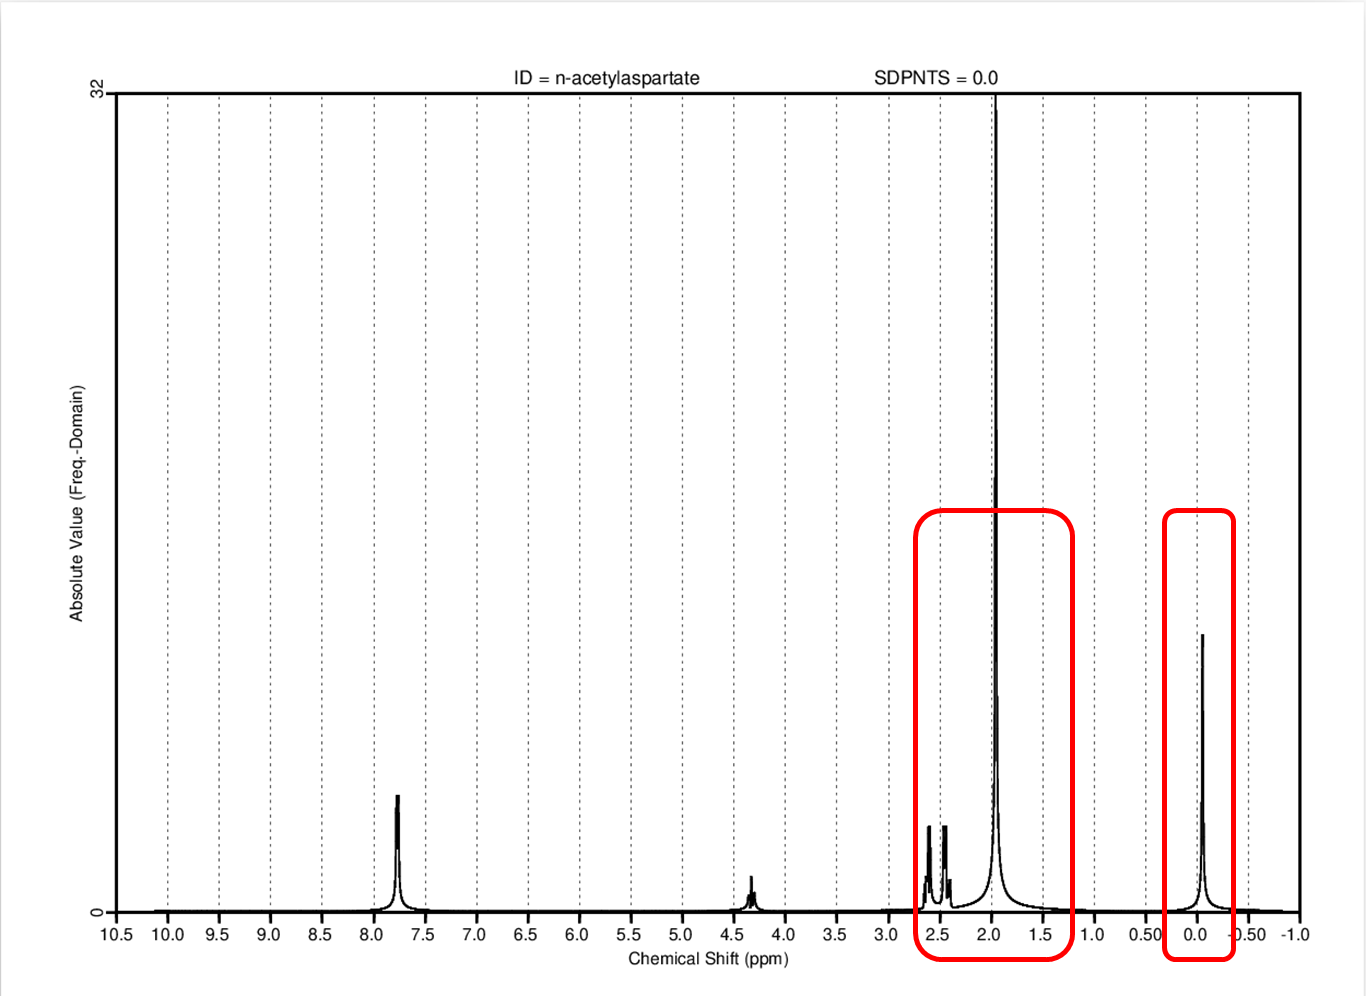
The NAA.RAW file generated by vespa was then opened in LCModel using plotraw.in and the positions of the NAA peaks and the TMS reference peaks were found to have changed.
I think that you need to change your ppmapp and ppmpk values because they determine where to look for the DSS/TMS peak (which, looking at the NAA simulation, I’m not sure is actually at 0 ppm in your simulations?!).
Hi Georg, @admin
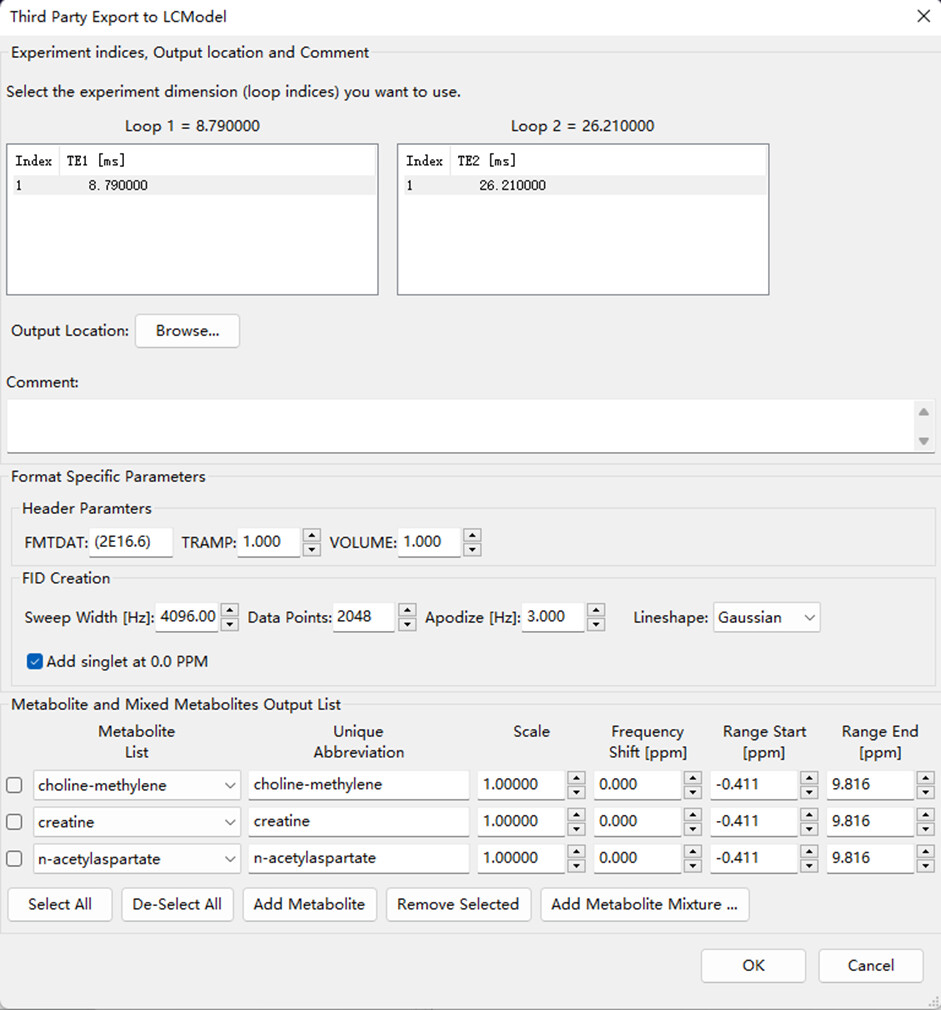
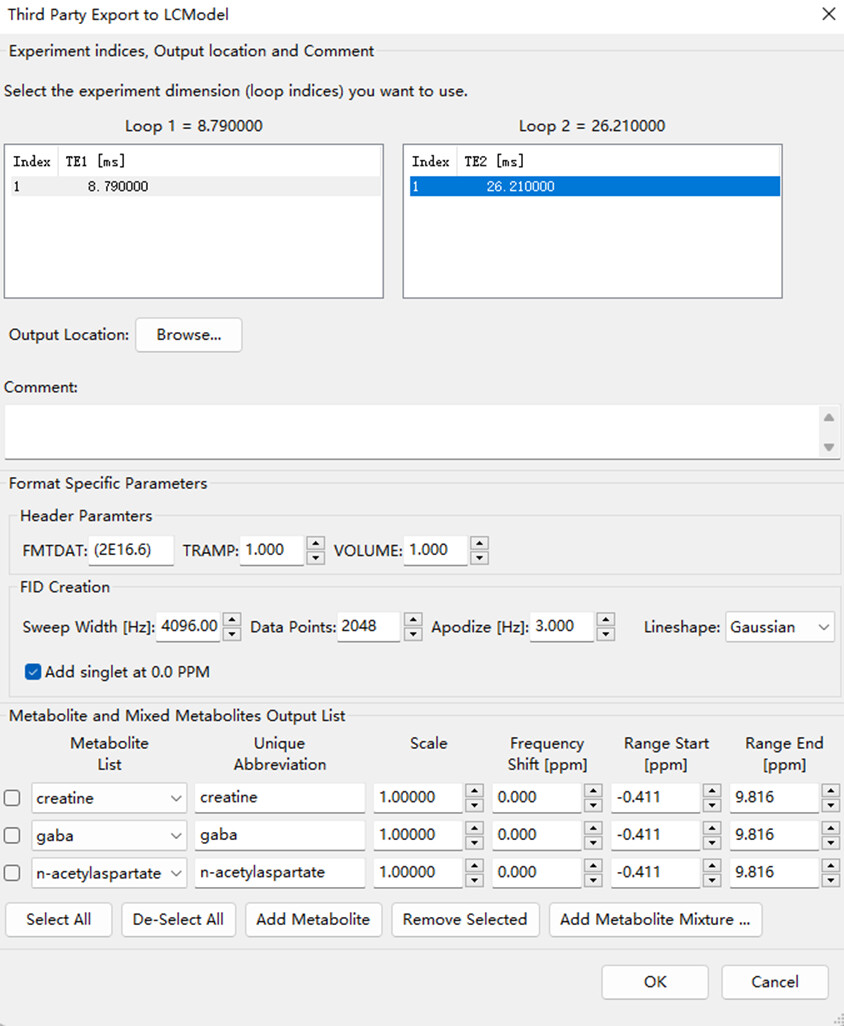
When I exported the data to LCModel format using vespa, I ticked add singlet at 0.0ppm. Does this mean that the DSS/TMS peaks are added at 0ppm? But when I open the .RAW file using plotraw I find the DSS/TMS peak at 2.5ppm and the NAA peak which should be at 2.01ppm is at around 3.4ppm.
I also tried using NOSHIF=.TURE. as you suggested above, but the results still don’t seem to change. Also I changed the values for PPMAPP and PPMPK but I’m not sure if I followed the correct direction, but the results didn’t seem to be too good either.
I’m wondering if there is something wrong with the .RAW file I generated from vespa simulation. so I have also generated .RAW files using FID-A simulations toolbox. After opening it with plotraw, I still had the same problem.
Yeah, something like that. It’s a little strange that the DSS/TMS singlet appears ~1.9 ppm to the right of the NAA singlet, whereas the two peaks should be exactly 2.01 ppm apart.
Hi @Meredith
As you can see above, in my NAA simulation with vespa, the TMS reference peak is around 2.5ppm, so I set the PPMAPP to 2.6, 2.4 and the PPMPK to 2.5. What is bothering me now is that the position of the generated reference peak is not at 0ppm. I would also agree that when the reference peak position is at 0ppm, PPMAPP =0.2,-.2, PPMPK = 0. is a good solution.
Thank you @admin
I also think it is strange that the distance between the NAA and TMS peaks is 1.9 ppm, and to your point I will also ask @bsoher about VESPA related issues.
Hi @bsoher
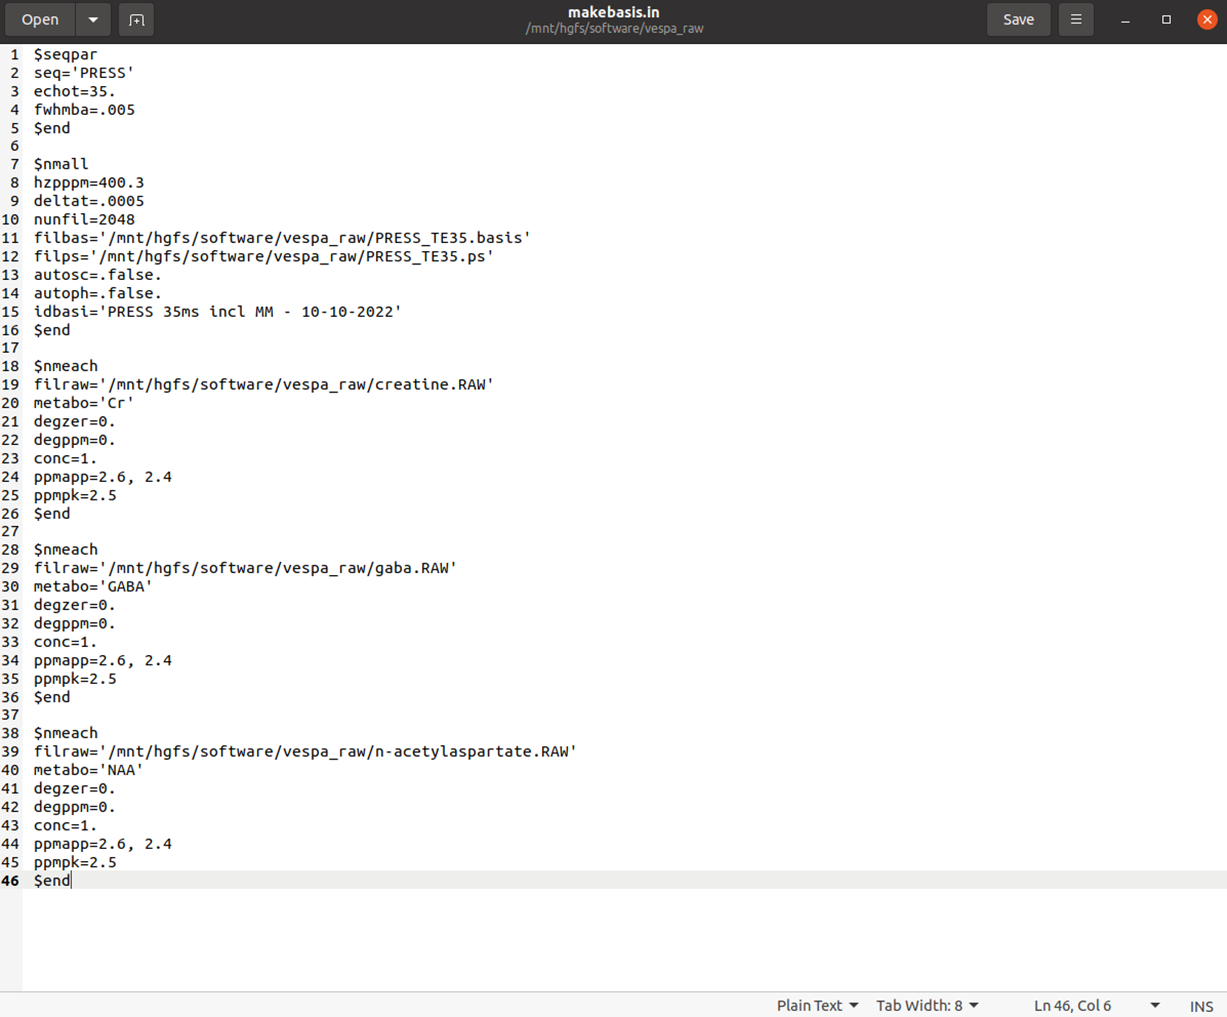
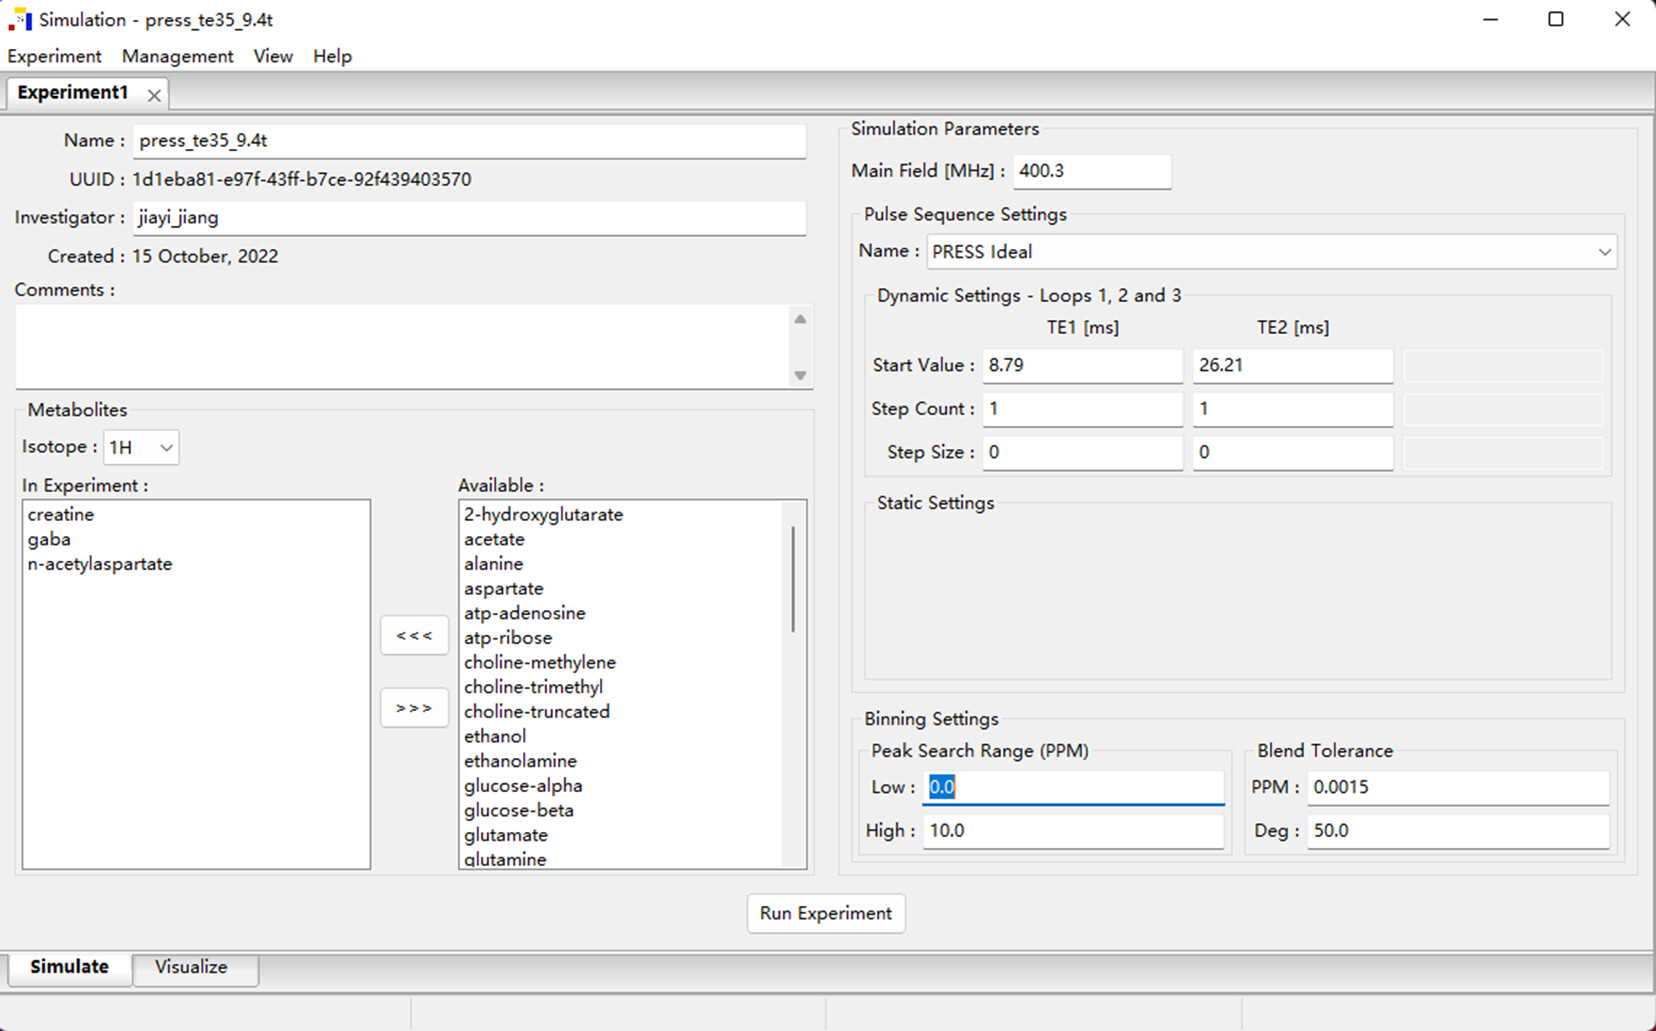
When I simulated the NAA peak using VESPA, I entered the following parameters, is it possible that the parameters I entered are causing anomalies in the simulation results? Causing the difference between the NAA and TMS peaks is 1.9ppm.
So, caveats first. I’m not an expert on using LCModel, so expect some possibly oddball suggestions from that.
Looking at the plot above you created using plotraw.in (which I’ve never used), your TMS is actually 0.9 ppm to the right of NAA, not 1.9ppm. The whole x-axis is contracted, if you look at the delta ppm values between the reference groups. Can you check how the Vespa NAA output got imported for display again, please? Did the center frequency get reported correctly, maybe?
Or did you use the correct center frequency in the Vespa simulation? It defaults to 3T in the GUI.
Not sure about the FID-A issue.
Happy to keep chatting if you can help me understand how the Vespa .RAW files gets into plotraw.in display!
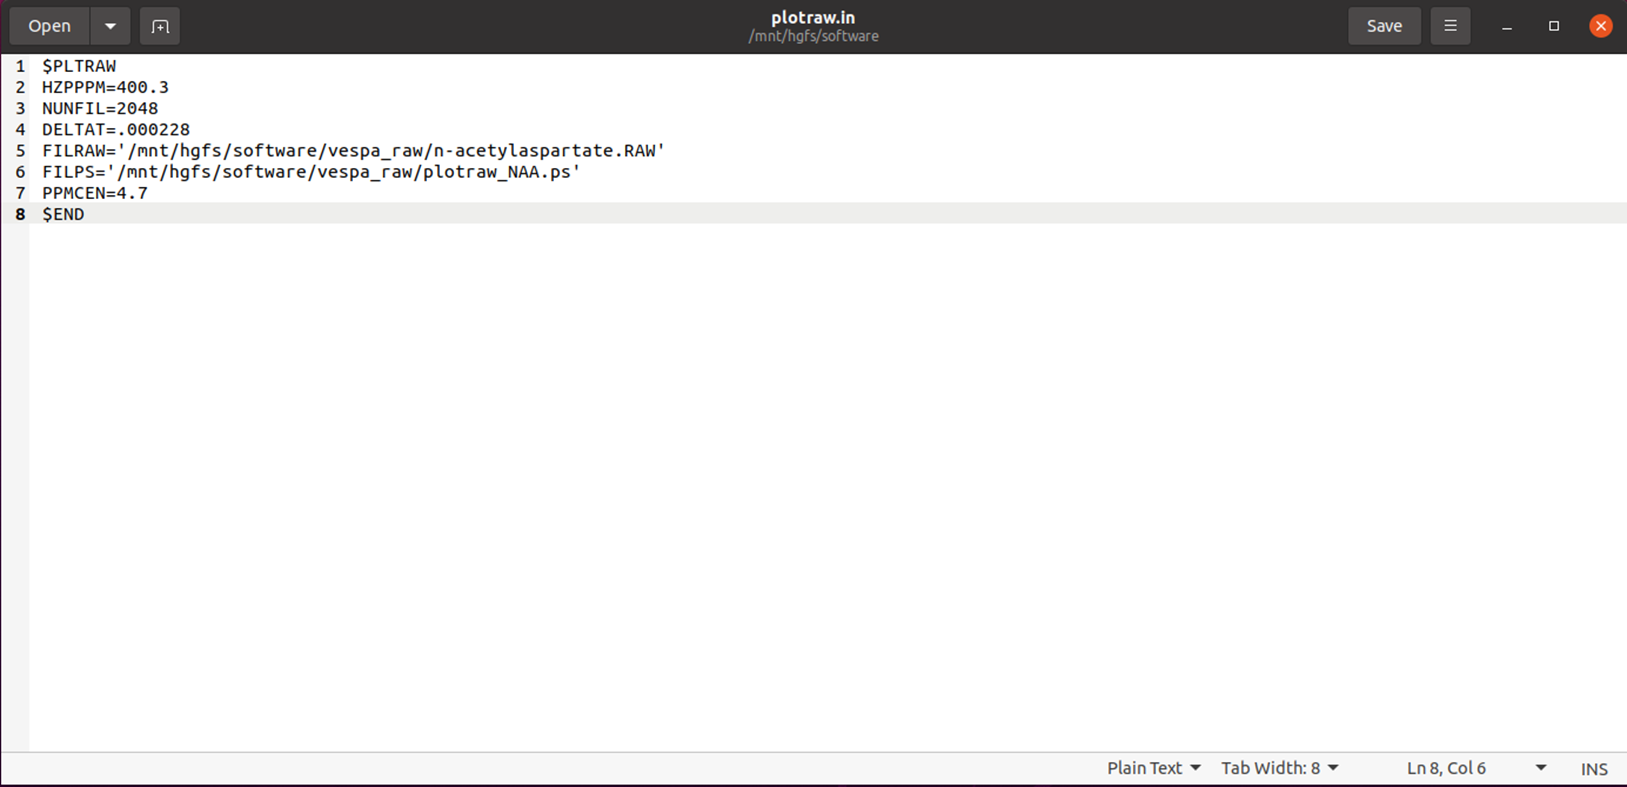
It looks like there is a mismatch in your makebasis deltat (.0005) and your Vespa bandwidth (4096 Hz). If plotraw.in also has deltat=.0005, that can cause the incorrect reference peak. I was able to reproduce this with my NAA.RAW by setting deltat to the wrong value in plotraw.in:
Hi Meredith, @Meredith
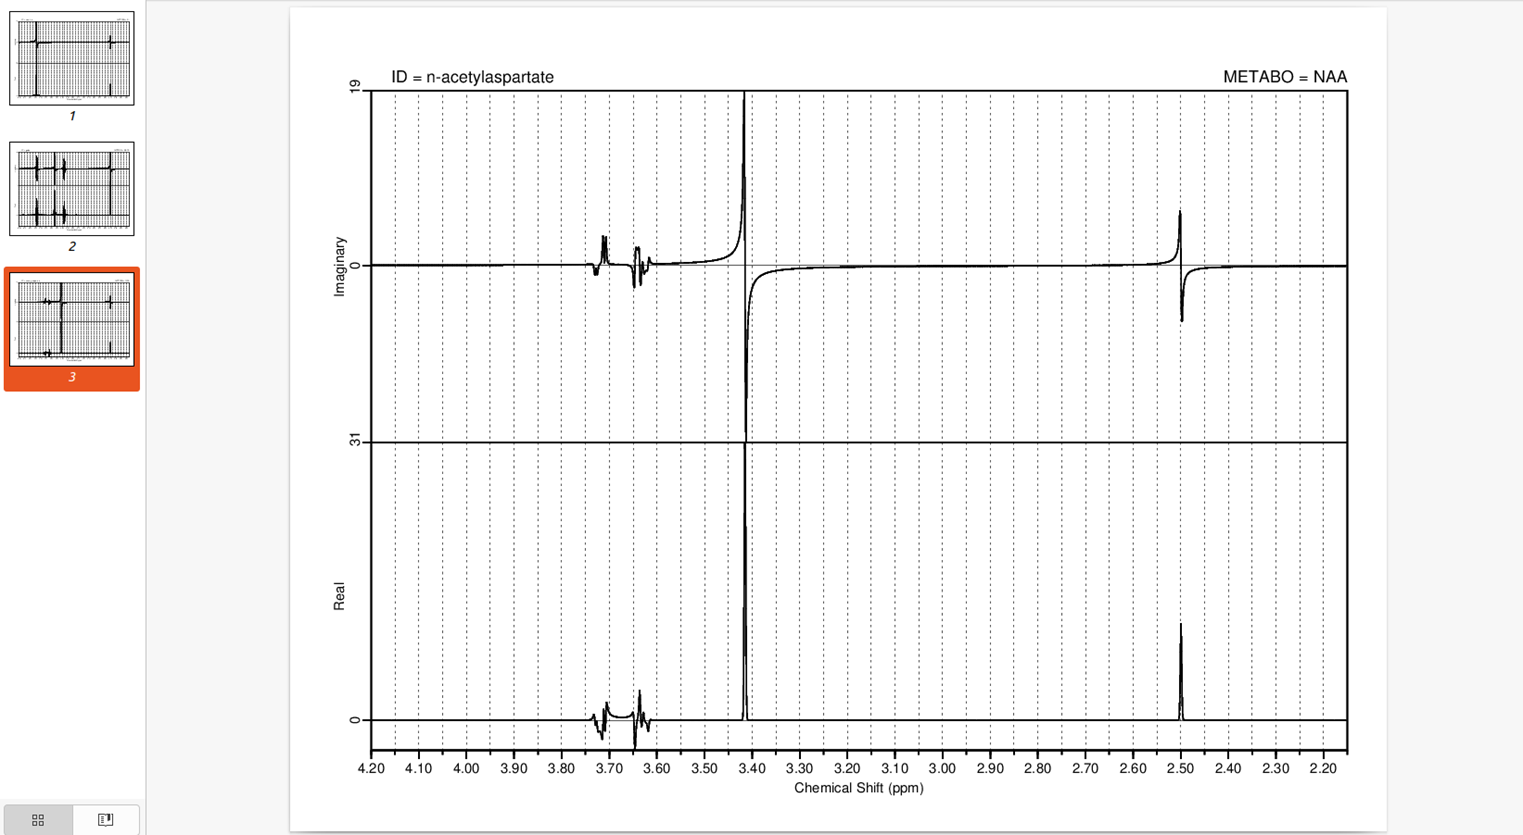
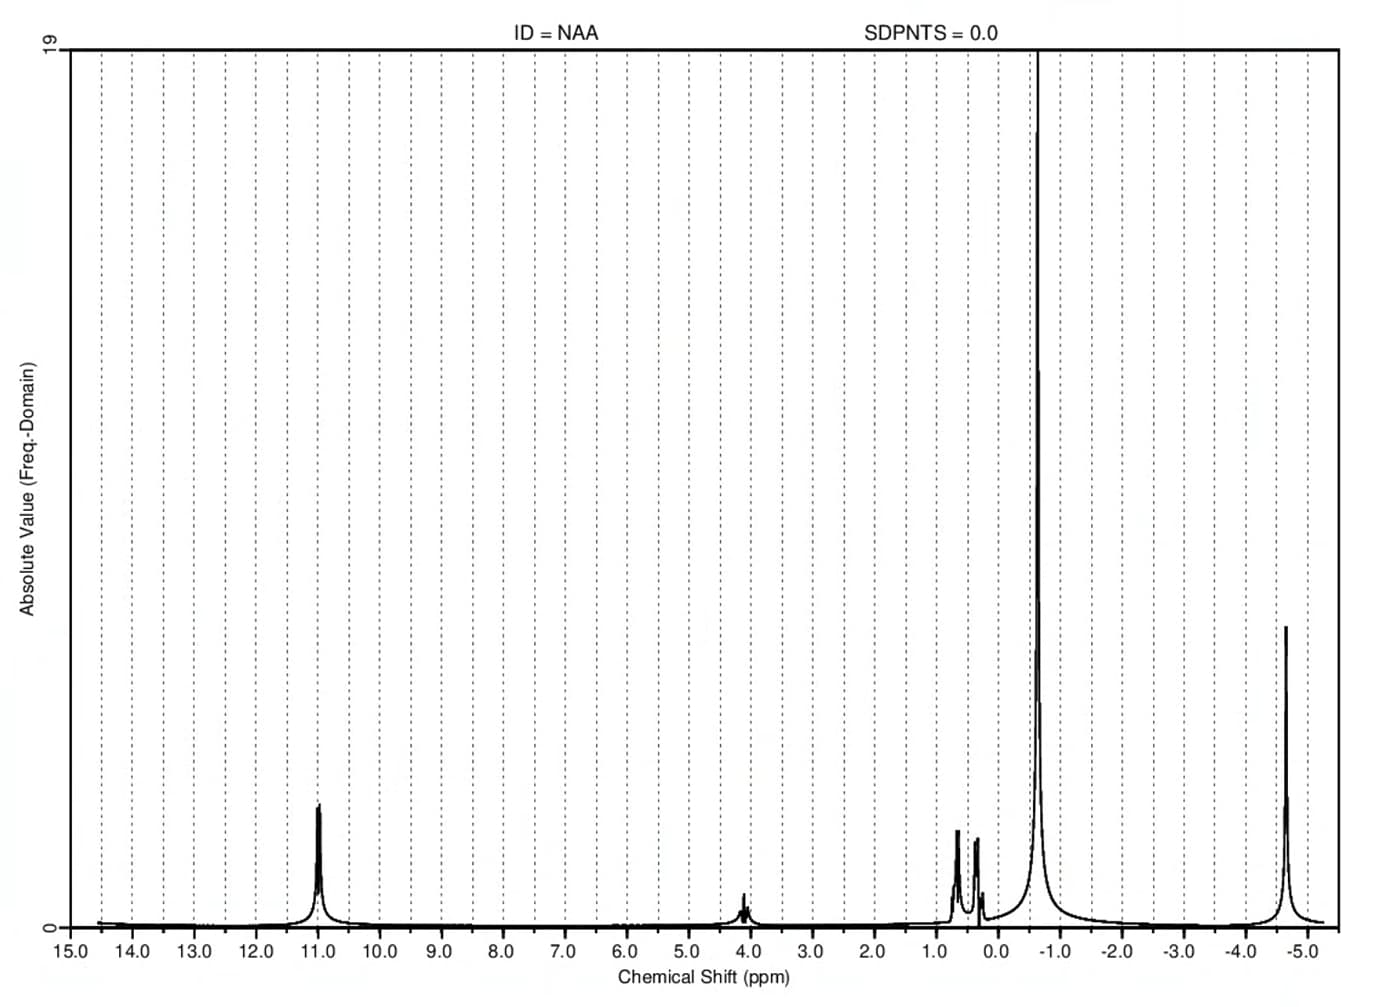
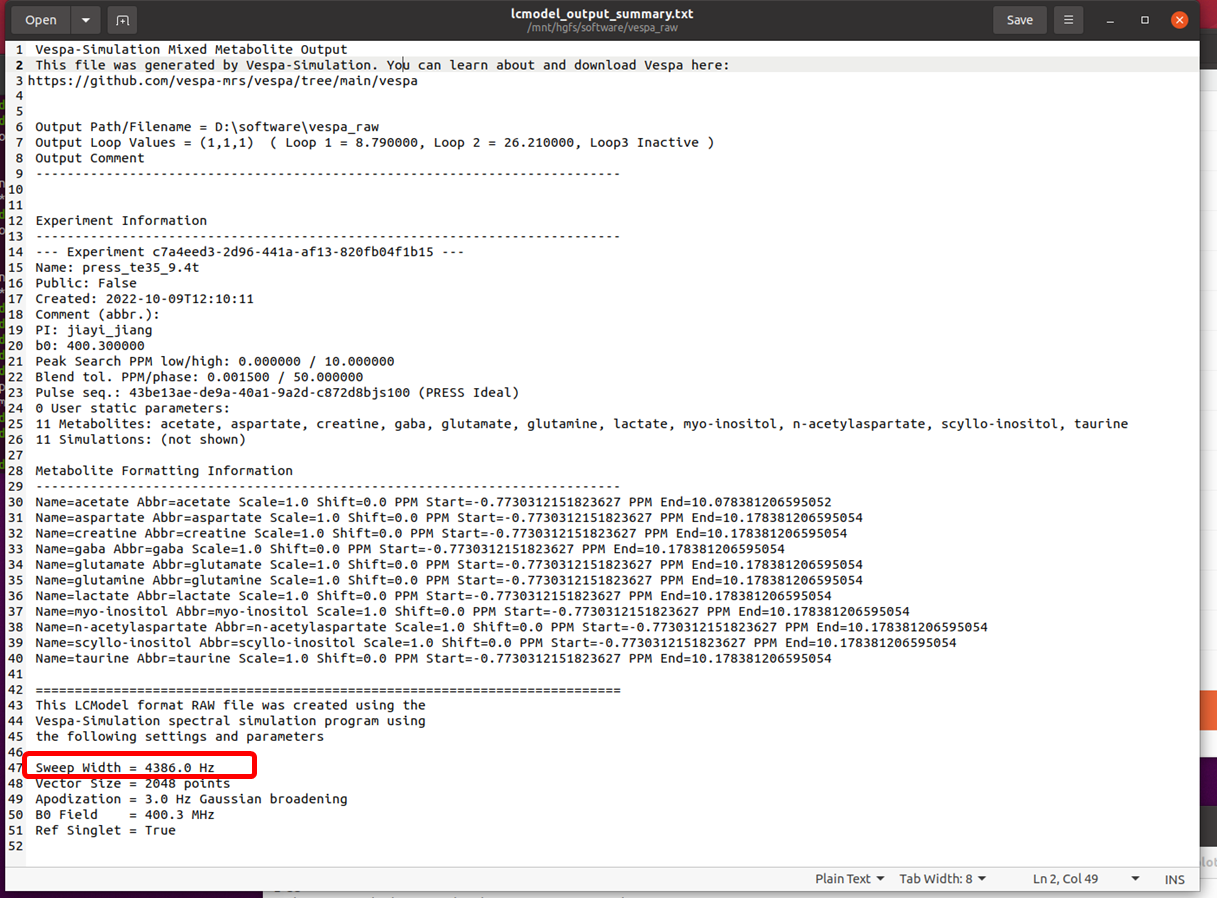
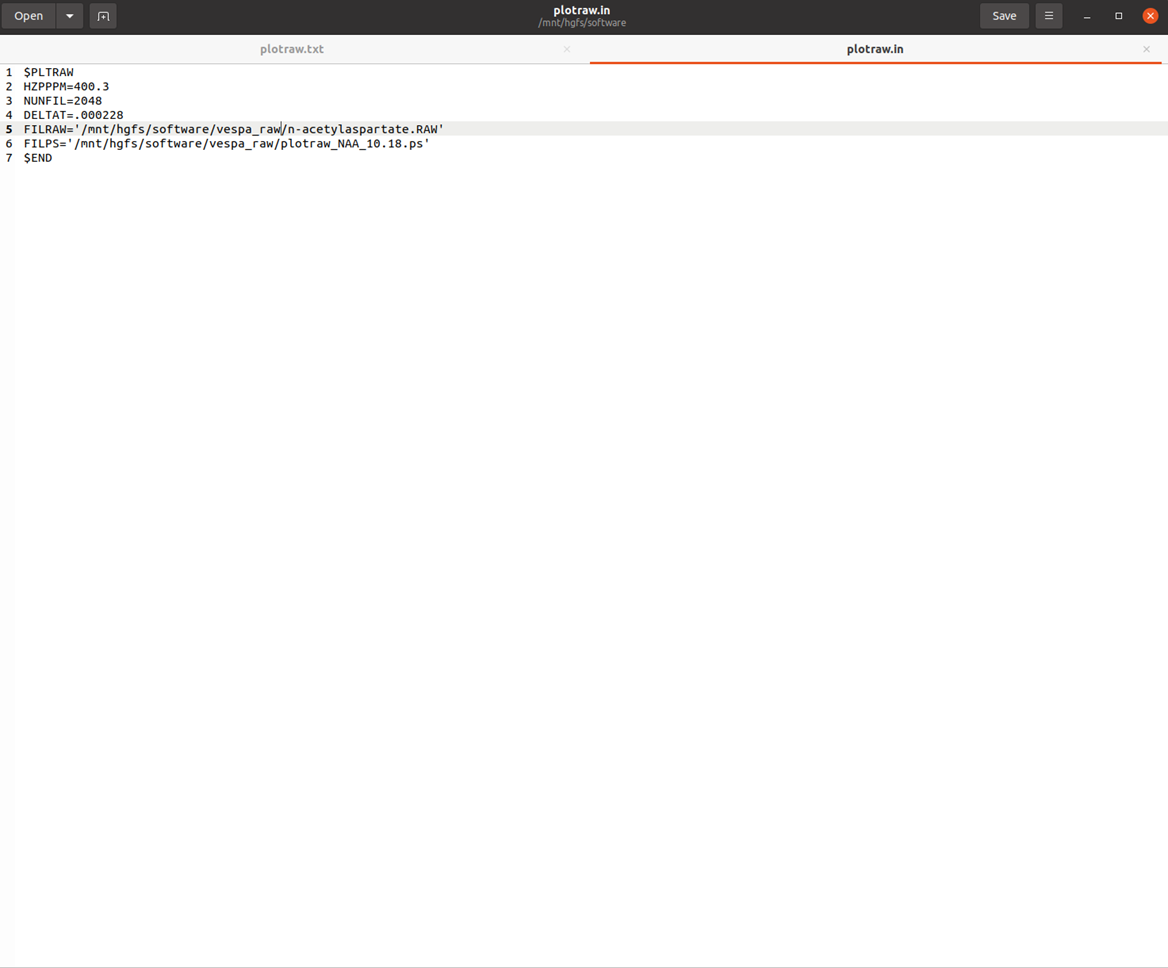
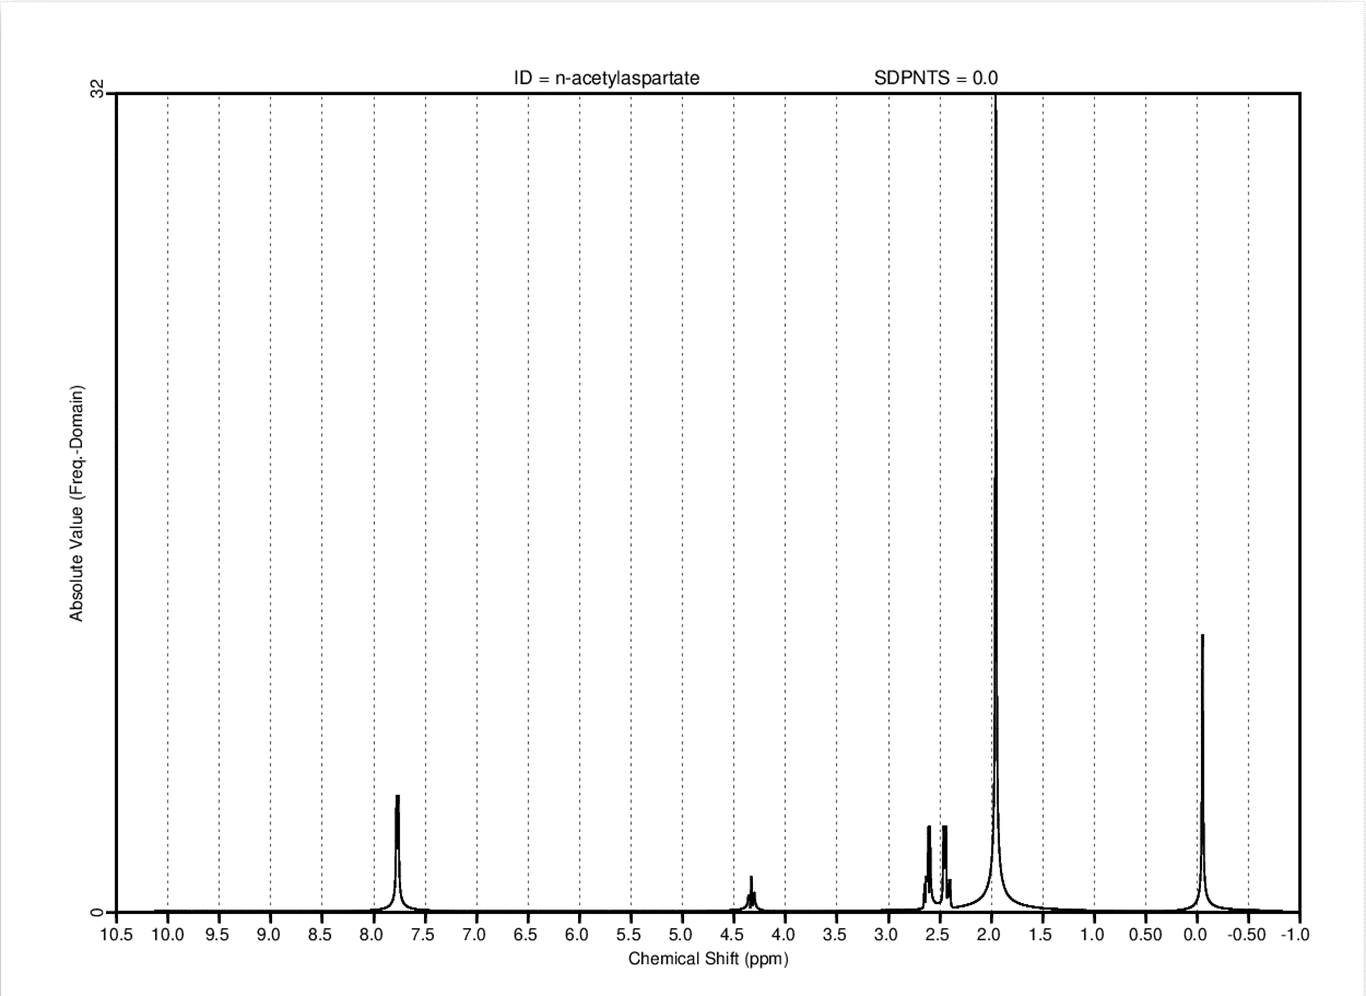
Thank you so much for your patience in answering my questions, your advice has been very helpful and solved my recent troubles. Following your advice, I have modified the deltat from 0.0005 to 0.000228, to match my bandwidth (4386Hz). When I open my NAA.RAW with the modified plotraw.in I get the following results:
Hi Brain, @bsoher
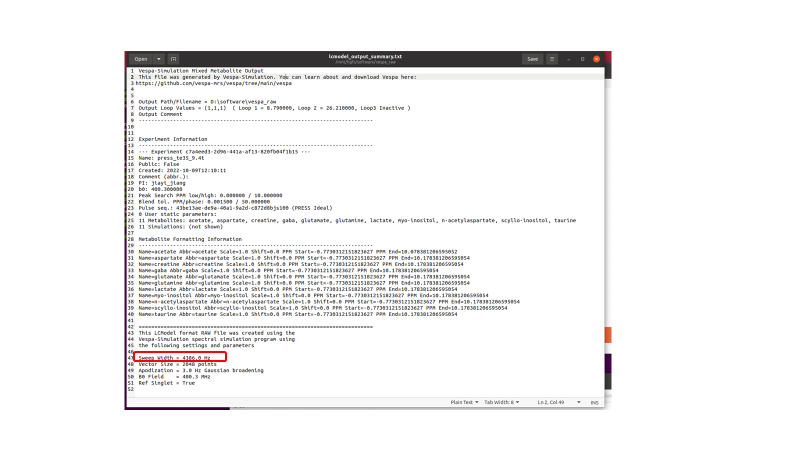
Following Meredith’s suggestion, the deltat(0.0005) in plotraw.in was changed to a deltat(0.000228) matching the bandwidth(4386Hz), and the NAA.RAW was opened with the following result, which seems to be a great improvement, but the position of the NAA peak relative to 2.01ppm Is this due to the change in centre frequency you mentioned before? (How can I view and change my centre frequency in the vespaGUI, I am simulating the spectrum at 9.4T) or is this due to something else?
I called it ‘central frequency’ but in your lcmodel_output_summary.txt file it’s listed as B0 Field = 400.3, which matches your plotraw.in HZPPM=400.3 value. So, no. That’s probably not the issue.
One thing that it might be is that the LCModel FIDs are created assuming that the PPM value for the center frequency is 4.7ppm. Does LCModel assume 4.69 PPM? Maybe Meredith knows a setting for LCModel to check on that?
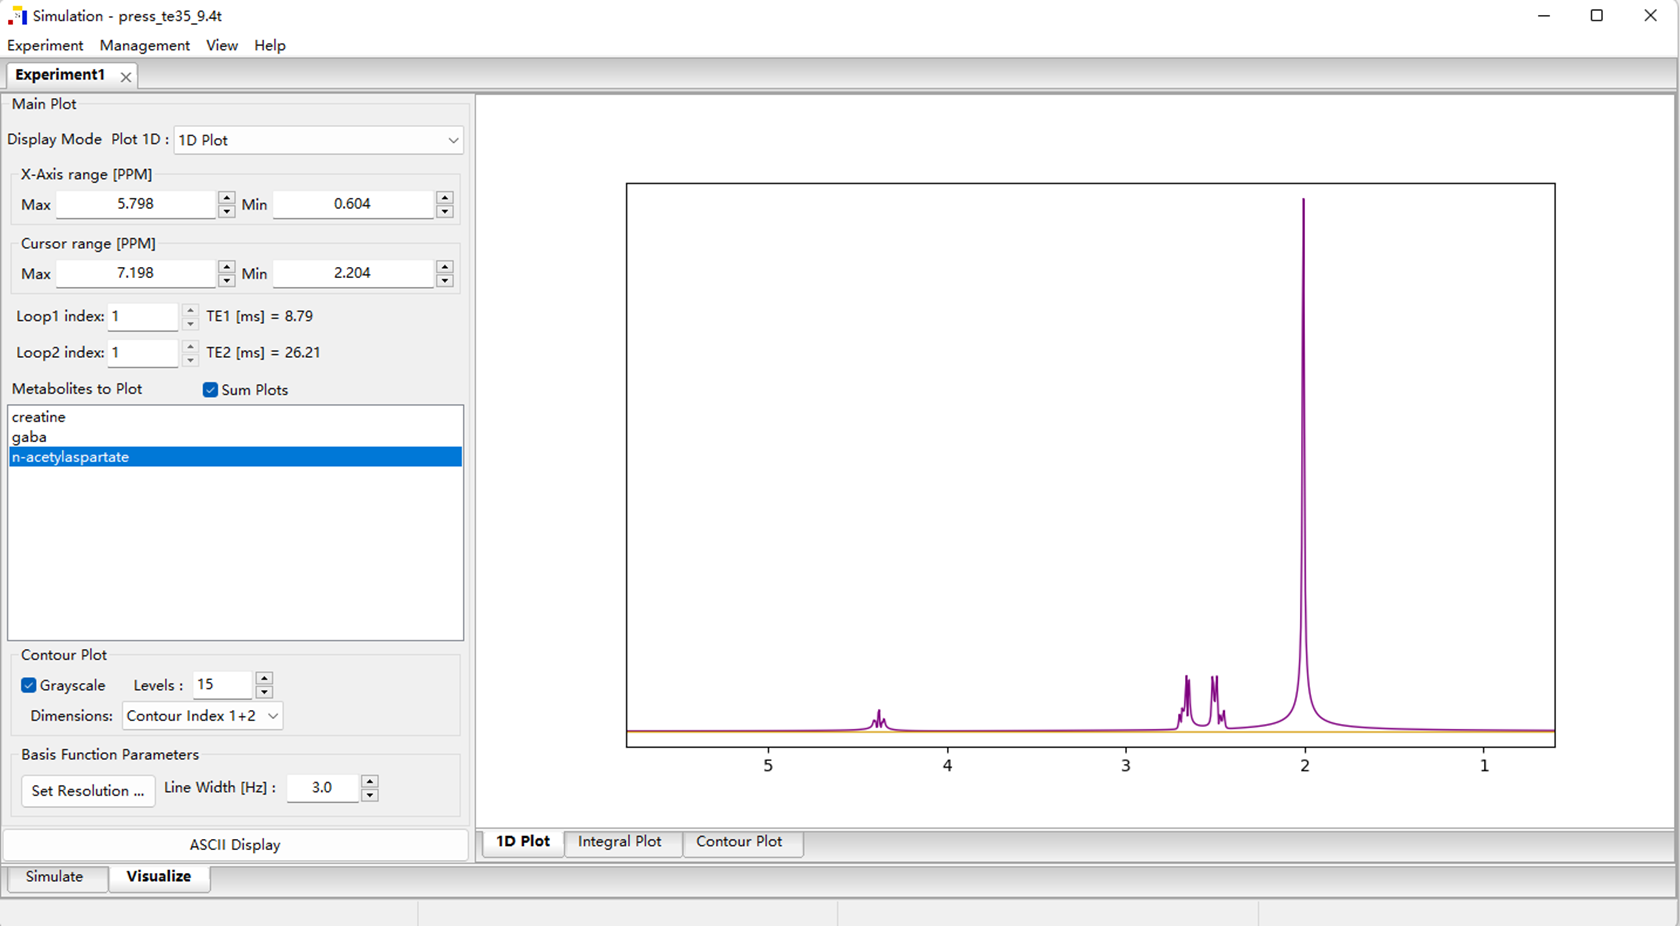
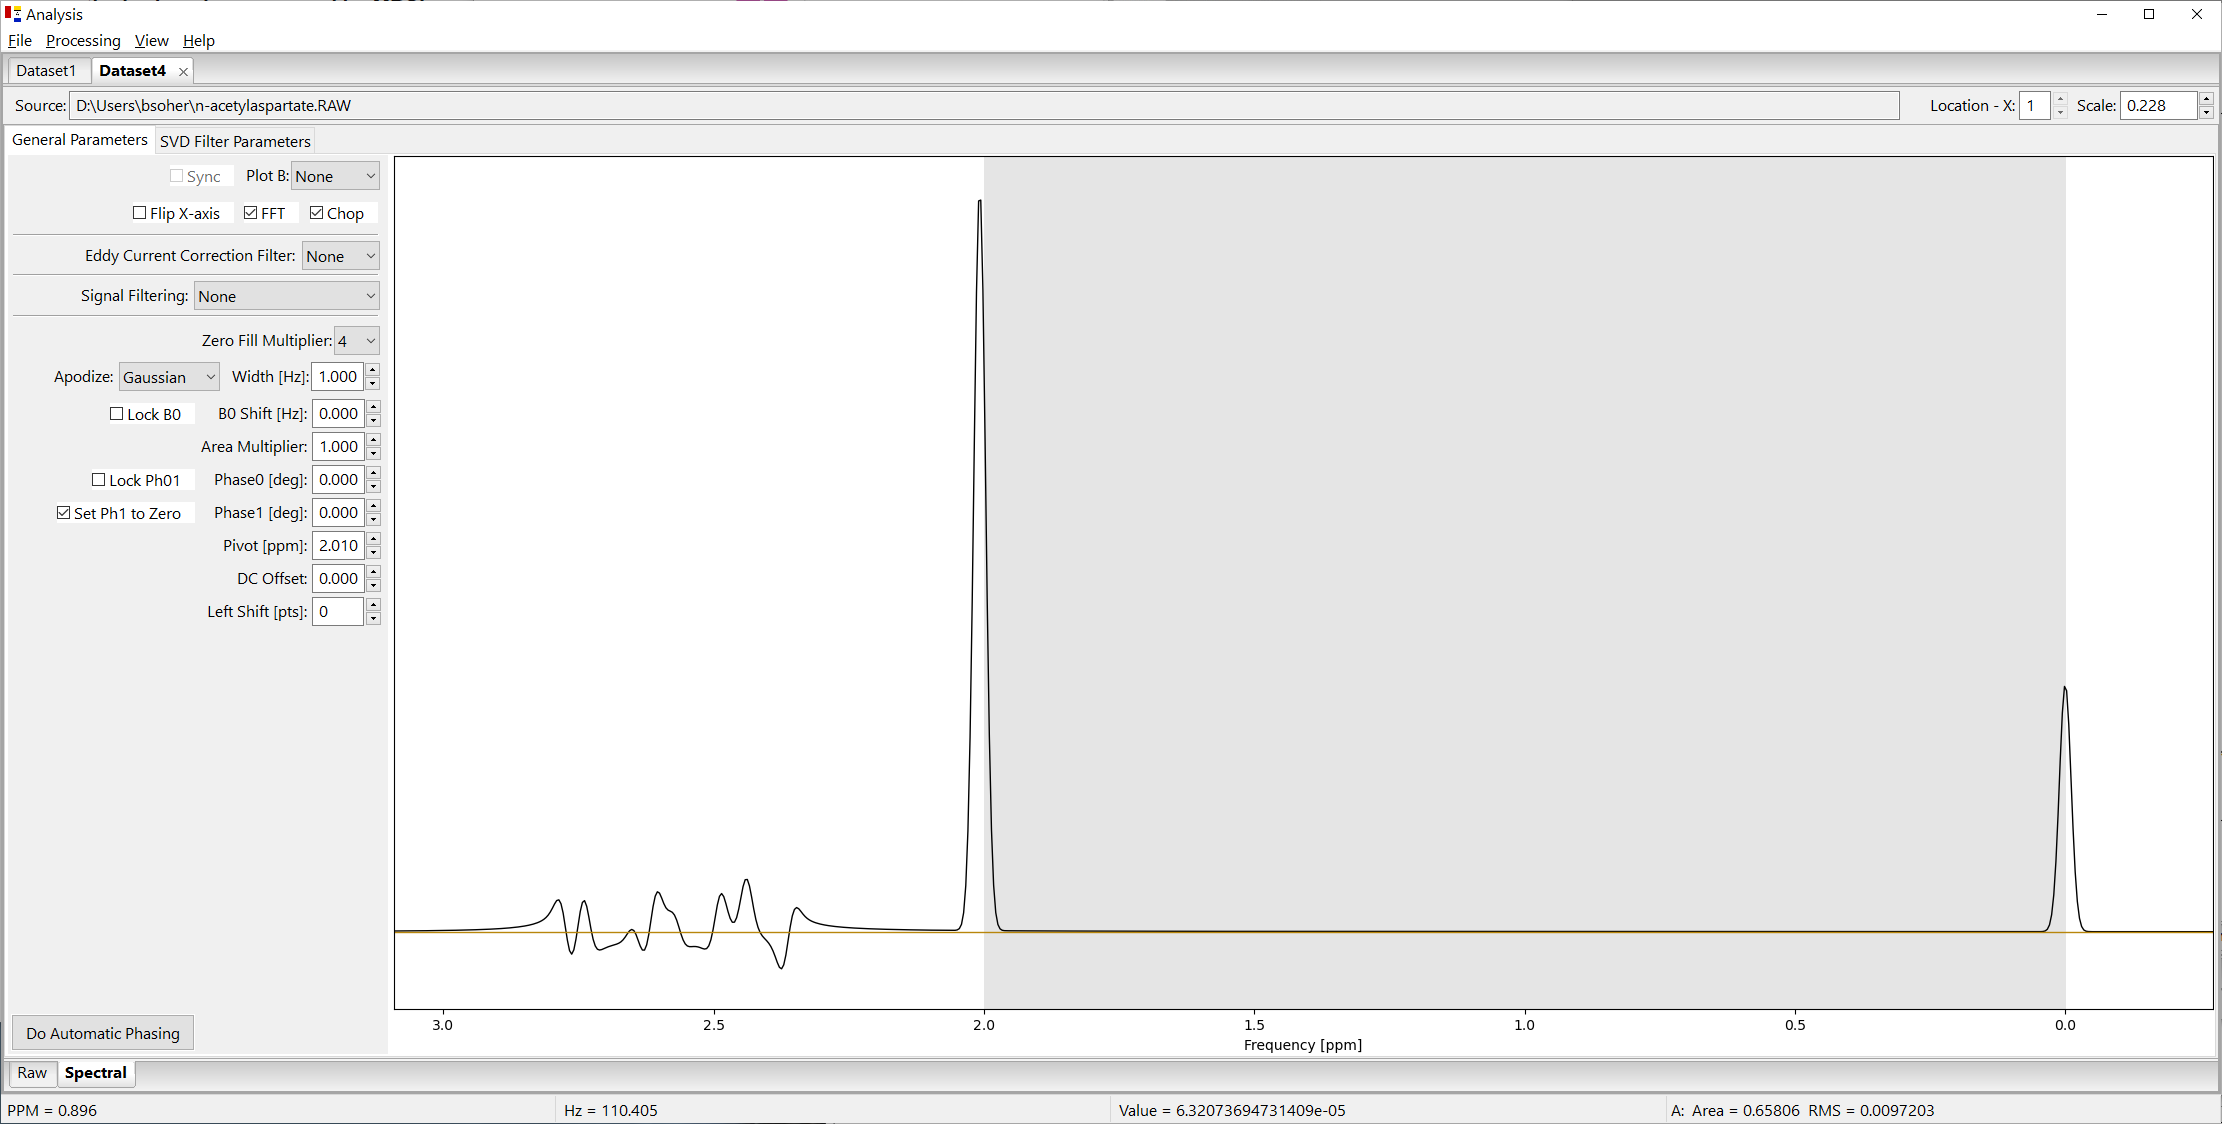
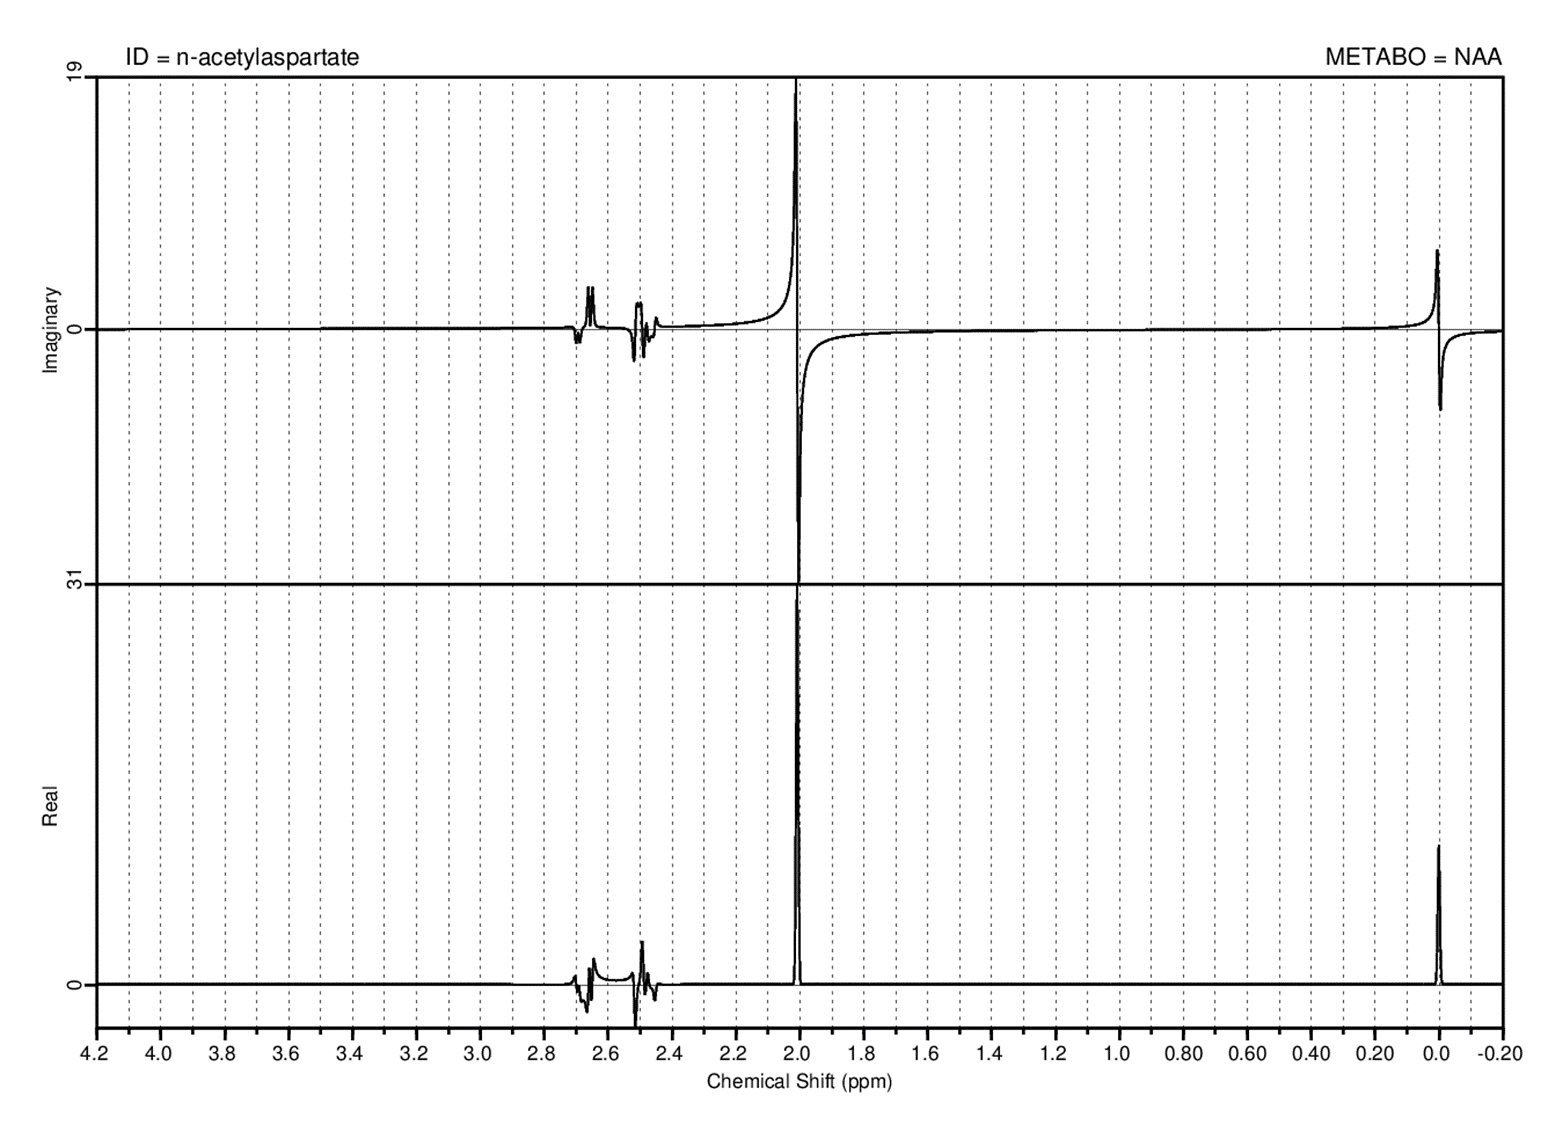
I ran a similar experiment, to check on internal consistency here, Ideal Press 8.79/26.21, but for 123.25 MHz (B0 field) and output for 1024 pts across 2000 Hz sw. I had to match the values of a data set that I loaded into Vespa-Analysis, and then I could load the .RAW file in using the acquisition values for that first dataset. (Yes, it’s a hack, but it lets me load .RAW files when I need to ). See attached screen grab of the Analysis program. The TMS peak is aligned with the gray ref line at 0.0 and NAA singlet a bit to the left of the gray ref line at 2.00, which is correct as it should be at 2.008 ppm.
So the .RAW files I create are consistent with my other software. Not a solution to your problem, but one more thing I can check off the list of possible causes.
Are you able to use the .RAW files even if the TMS is shifted a bit, assuming that all the .RAW files have the same shift?
As you say, I generated the basis set using .RAW files with some shift.The TMS and water peaks seem to have been corrected automatically. The results of the basis set seem to be pretty good.
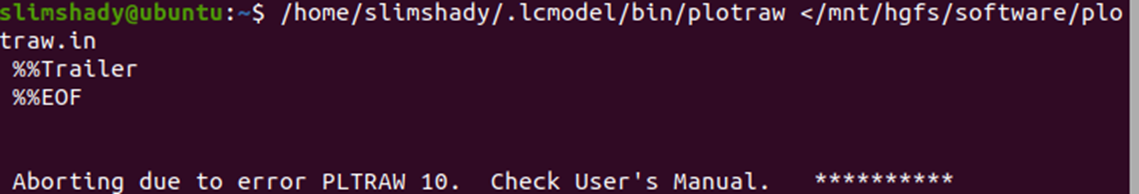
That’s a good question, and I actually had not tried it with plotraw. I got the same error that you did. From the manual section 8.5, it looks like PPMCEN is not a parameter that can be changed for plotraw. It is a control parameter for analysis. My apologies for the confusion.