Hello professors,
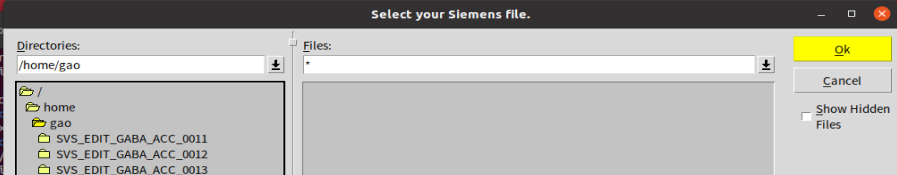
I’ve been recently using Lcmodel to process our GABA data, but I’ve encountered an unresolved issue during the processing. We have a Siemens machine, and the scanned data is organized into three folders, with each folder containing three IMA files.
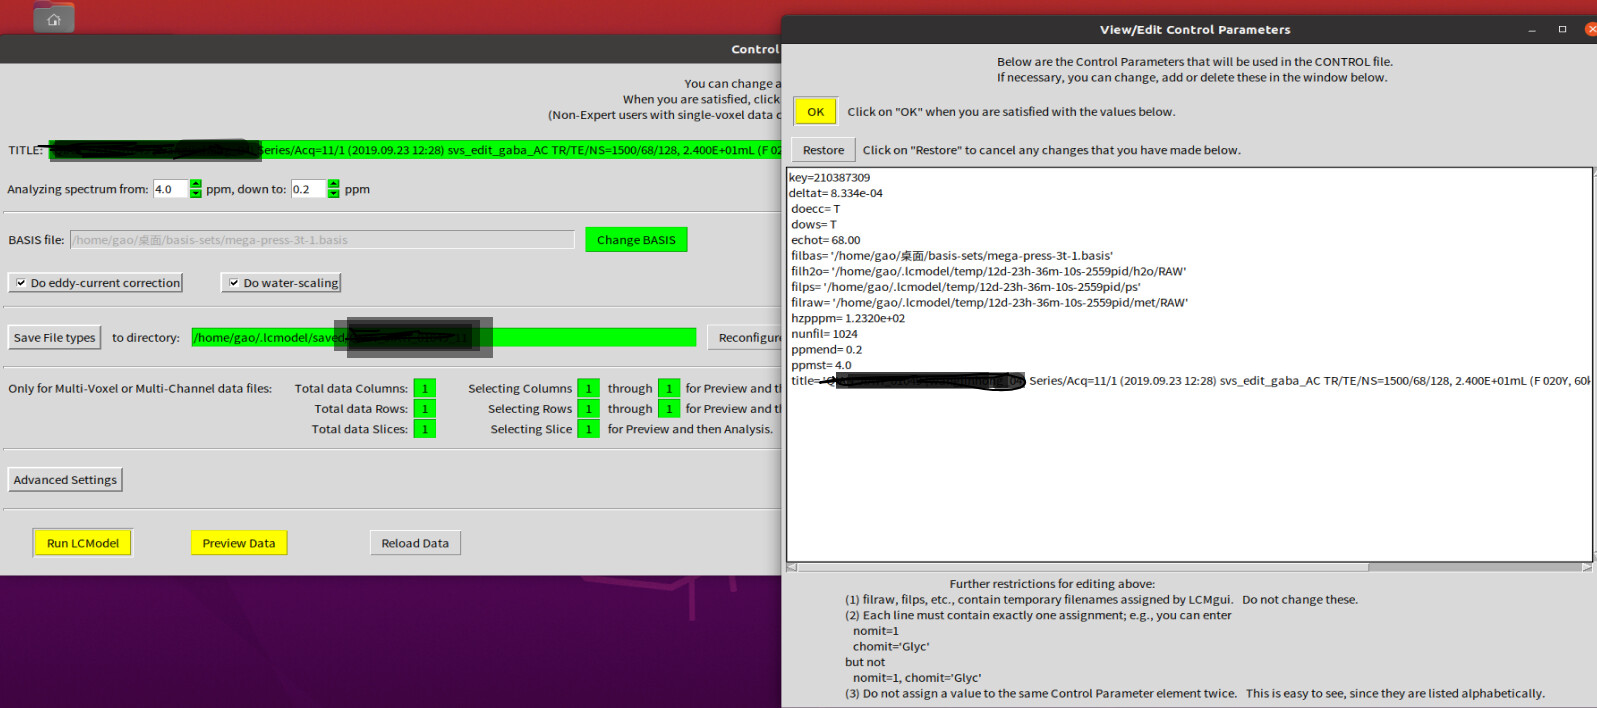
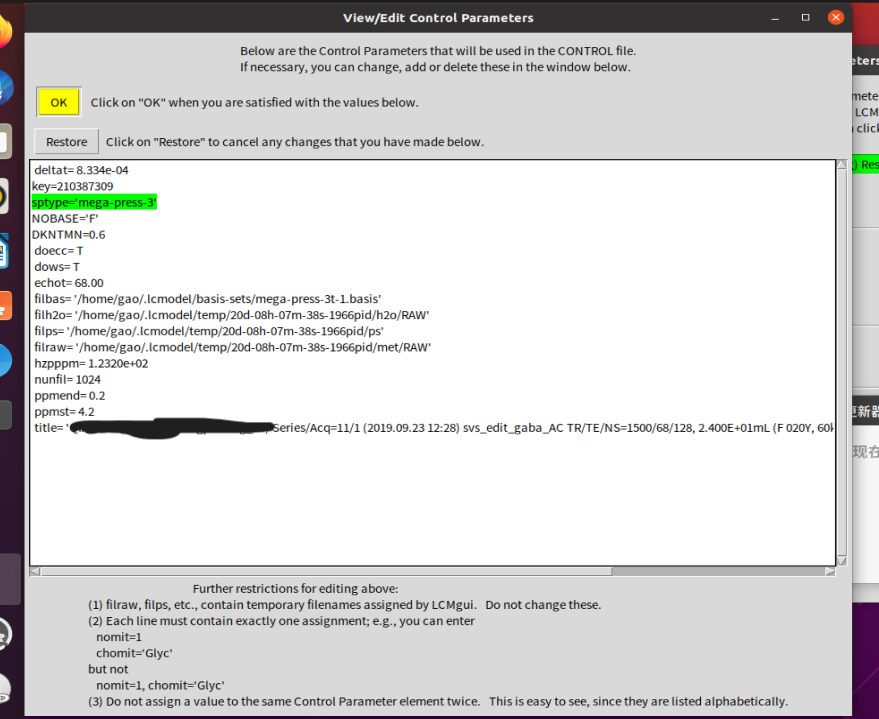
this is how we setting:
I would like to earnestly request all the experts to inform me about the underlying cause of this issue. Additionally, I have asked others, and they have been able to obtain glutamate (glu) results from their ima files without any problems. Thank you!!!
LCModel doesn’t know how to generate the GABA-edited “difference” spectrum.
My guess is that your RDA files contain individual transients (edit-ON and edit-OFF interleaved), which LCModel isn’t able to combine meaningfully, beyond just stacking them all together. In this case, your best bet would be to preprocess the data with an external tool designed to handle edited data. Osprey is probably the most convenient option for this, but plenty of other tools can do it with a bit of extra scripting.
This is a recognisable difference spectrum, but I’m not sure I’d call it the “right” result – quality isn’t great (low SNR, broad linewidths) and the baseline model is very unstable. The quality might improve a bit with different preprocessing (eg, improved alignment of transients), but there may also be something not quite optimal with your voxel placement (location, size) or scan length.
Baseline fit can probably be helped with adjusting the LCModel configuration somewhat. Have a look at section 9.4 of the LCModel manual (the suggested SPTYPE='mega-press-3' implies a flat baseline), and maybe also our investigation of modelling algorithms, where we found a firm but non-zero baseline model to perform slightly better (SPTYPE='mega-press-3', NOBASE='F', DKNTMN=0.6)
hi professor Alex,
Greatly appreciate your response to my question.
We have three folders of scanned files(each folder contains three IMA files), and we selected the water suppression file (first folder) in the first step, and then set up as follows:
We added this:
sptype=‘mega-press-3’
ppmst=4.2
ppmend=0.2
NOBASE=F
DKNTMN=0.6
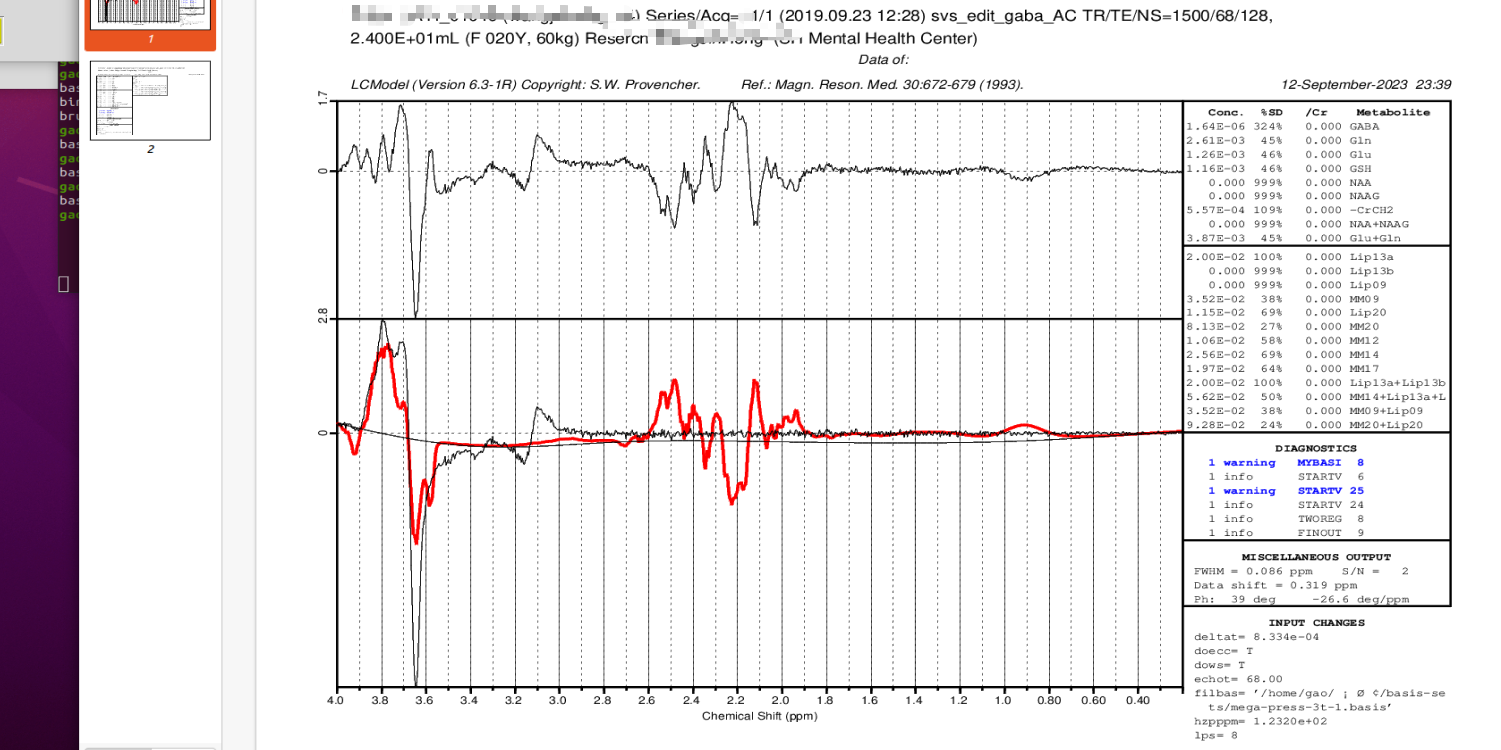
Next we select the non-suppressed water file(in the second folder),finally we got the this result:
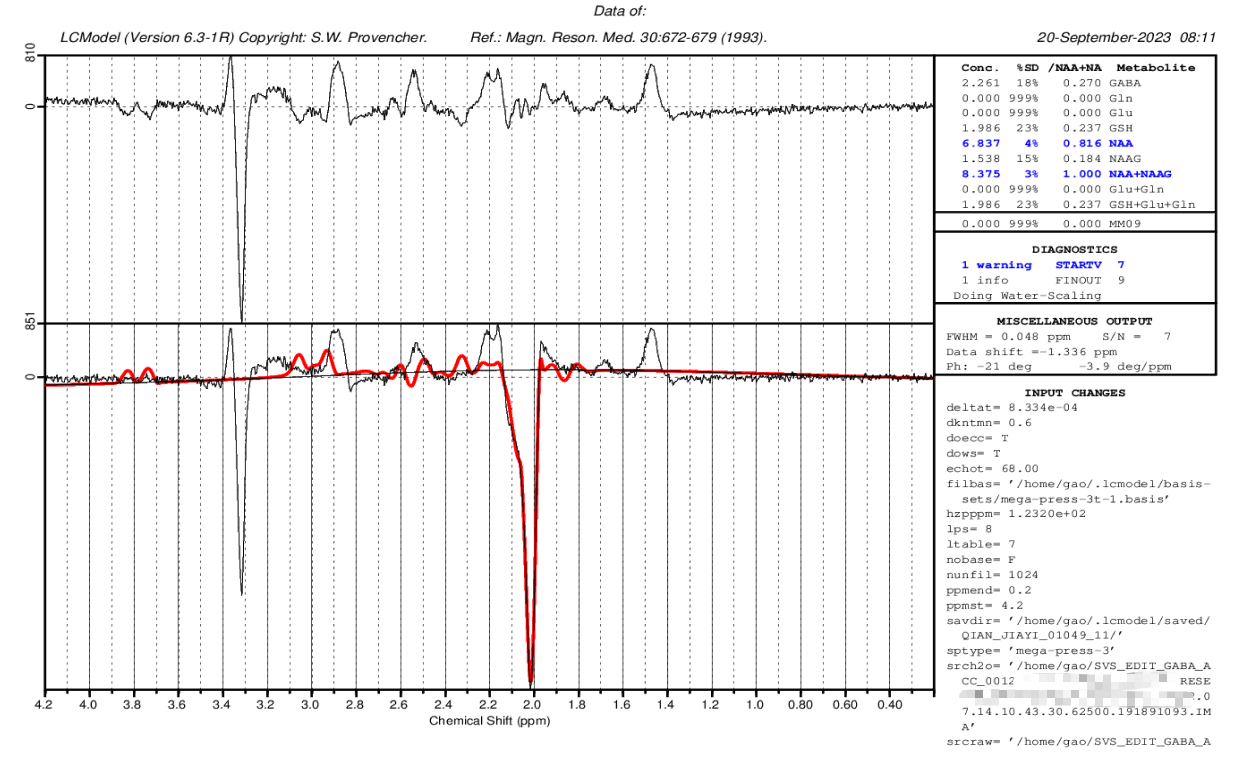
I would like to inquire if this RESULT appears satisfactory?
We followed the same operation steps for both RDA and IMA files, but the results are inconsistent. I wanted to ask if, as you mentioned, using Osprey would yield better results?
Thank you for your answer to my question!!
It looks like your DELTAT value is wrong this time, so apart from the strong negative NAA peak at 2 ppm, all your other peaks are appearing at the wrong offset – hence the model isn’t really fitting to the data, and you see very noticable peaks in the residuals (upper graph). This isn’t good.
Try changing DELTAT to the value you used before (4.160e-04), and see if that’s any better. That’s an unusual value though, I suspect 4.167e-04 might be better; the correct value should the the reciprocal of your spectral width (ie, 1/sw)… I couldn’t say for sure without knowing how the data has been processed.
Yes; there are plenty of tools which are better-equipped for dealing with edited spectra than LCModel. I suggested Osprey since the processing is fairly well automated there, and can integrate with LCModel if you still prefer that for the final fitting.
I noticed that you have three folders of scanned files (each folder contains three IMA files). You chose the water suppression file from the first folder and chose the non-suppressed water file from the second folder. I’m curious about the relationship among these three folders and what the three IMA files in each folder represent respectively. Would you mind sharing this information with me?
hello professor Alex:
I greatly thank you for your response.
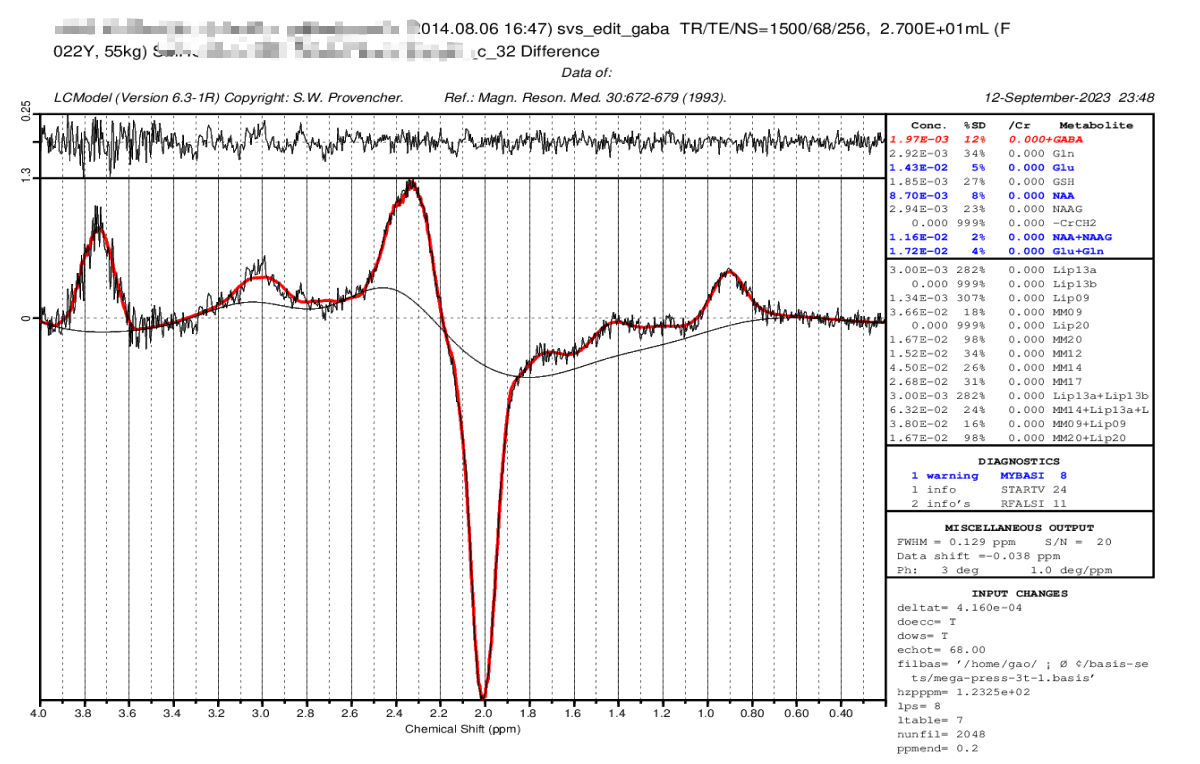
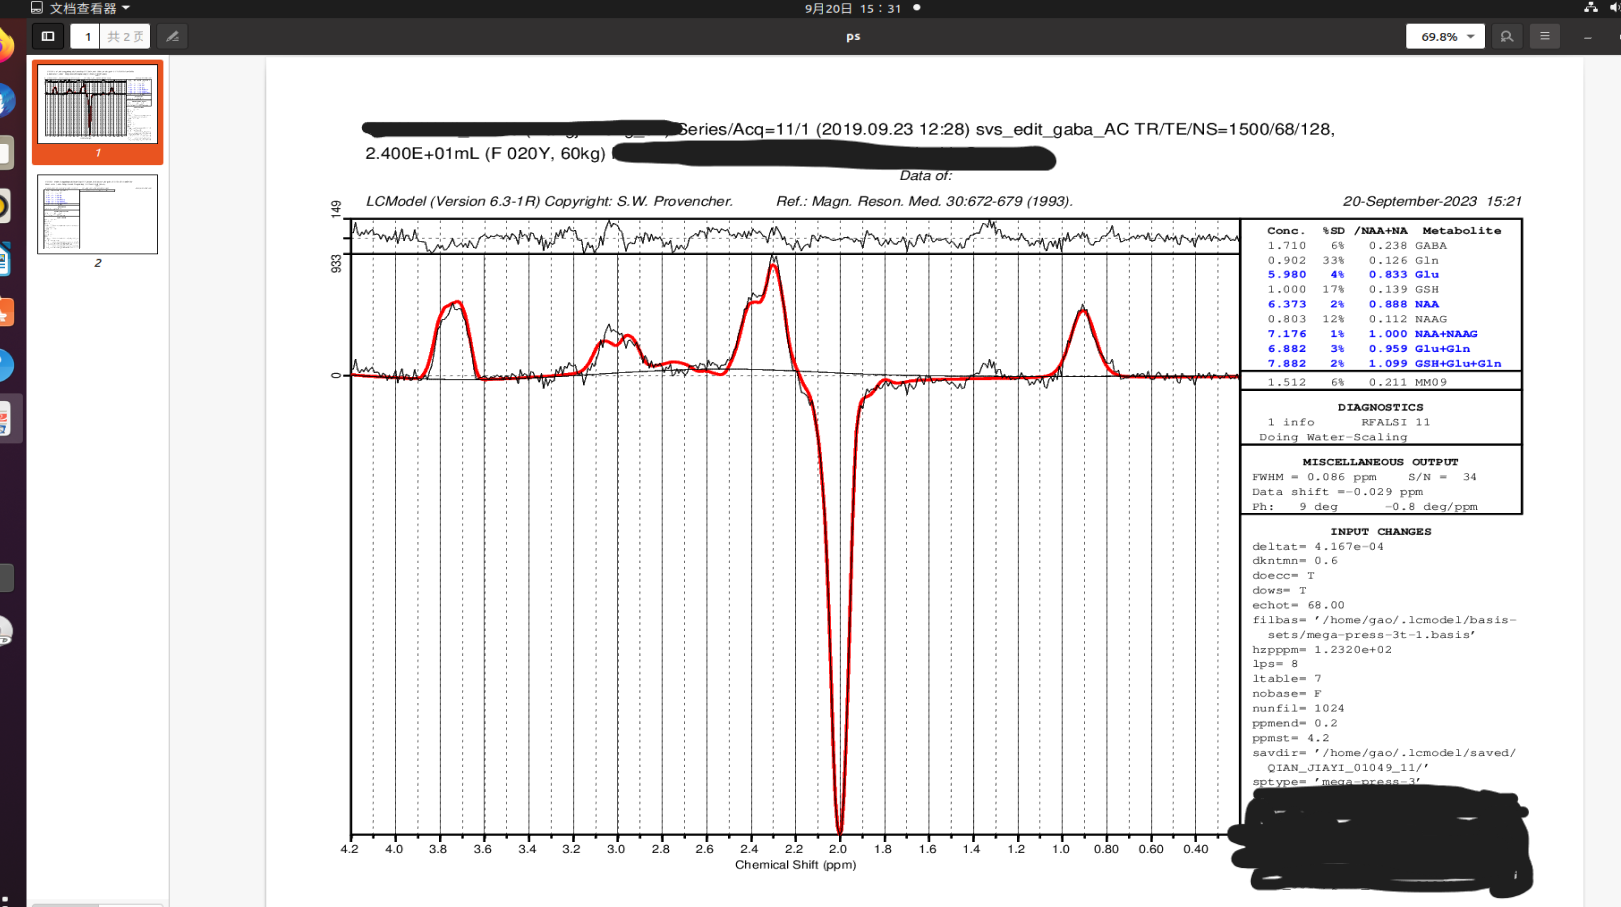
We changed our DELTAT to 4.167e-04, and the results seems to be good at this time, all the peaks are appearing at the ‘right’ place.
And could you please help to check whether it is “right” enough
Thank you for your time and effort.
Hi, Yushan,
Yes, our machine is Siemens. I am a clinical doctor, not an MRI specialist. I asked our MRI teacher this afternoon, but he only mentioned the contents of three folders. As for what each file represents, he is not very clear. I will consult another specialist about this again tomorrow.
Thanks for your attention!
There’s still some room for improvement, if you want. You’ll notice a few small peaks are still visible in the residuals (upper panel). It looks like you may be using a generic (LCModel-supplied) basis set for fitting; you should get better results with a basis set tuned to your specific sequence (as recommended in a recent consensus paper) – ideally also including a co-edited macromolecule component at 3 ppm. Your best bet would be to simulate your own using MRSCloud, but you could also try FID-A, FSL-MRS, Vespa, or use a ready-made Siemens-specific basis set eg from here: Dr. Dydak's Lab - Basis Sets (although this doesn’t include the macromolecule components, and some of the more recent implementations may account for a few more factors).
If you have the option to get your data in TWIX format, these are often preferable (gives you a lot more freedom to inspect and adjust the processing if needed.
hello, Alex
Thank you very much for your guidance. I feel that you have simplified the things in the manual and provided a lot of content that was not mentioned in the manual. It is very helpful and allows me to have a understanding of how to operate. I am extremely grateful.
i have not got the twix format. It was really a very challenging situation for me earlier to deal the IMA format.