I ran three consecutive MEGA-PRESS scans using the following parameter at Siemens 3T Skyra.
TR/TE=2000/ 68 ms, Average=96, voxel =3x3x3 and one non-water scan.
I processed the data using Gannet software. The stability between the second and third scans is less than 5%, and the first and second scans are around 15%, even though I used four preparation scans. Is it acceptable?
Why are there more fluctuations between the 1st and second scan compared to 2nd and third scan? Is there any reason for this?
Also, could you please tell me how to calculate the absolute concentration of GABA and Glx using Gannet?
Hi, @narayanan76. To assess the quality/reproducibility of your data, it would be very helpful to see your GannetLoad and GannetFit outputs. If you prefer, you can email your outputs to me at mam4041[at]med.cornell.edu.
In terms of calculating absolute concentrations, this depends on what data you have acquired. Since you have an unsuppressed water scan, GannetFit will give you a water-scaled concentration that is semi-absolute but not corrected for voxel-dependent partial volume effects (i.e., not tissue corrected).
For a “fuller” quantification, you will need T1-weighted structural images. Running GannetCoRegister (after you’ve run GannetLoad and GannetFit) will first co-register the MRS voxel to the respective T1 image. Subsequently running GannetSegment will segment the T1 image and MRS voxel mask. Once you’ve done this, you can run GannetQuantify to obtain tissue-corrected (pseudo-)absolute concentrations for GABA and Glx.
More details on how Gannet calculates absolute concentrations can be found here.
Let me know if you have any questions about any of this.
I would add that test-retest CV of GABA-edited MEGA-PRESS is usually on the order of magnitude of ~5-15%, so I don’t think the variation that you have observed is too outlandish. I would maybe expect it to be slightly better if you ran them back-to-back (without repositioning). But 96 averages isn’t that much (is that 96 in total, i.e. total acquisition time of 192 sec, or 96 ON + 96 OFF, i.e. a total acquisition time of 384 sec?), and modeling is always susceptible to noise.
As Mark suggests, it is helpful to include GannetLoad and GannetFit outputs to judge data quality.
Recently, I ran five consecutive MEGA-PRESS scans with 256 averages (around 9 minutes) in four subjects. I know two subjects moved around the 4th scan. Is there any surrogate measure of movement in these MRS data? Can one use the individual spectra obtained to decide whether or not someone has moved?
What is surprising is that the subsequent scan after an outlier is similar to scans prior to the outliers. Thus, it might be the movement within a scan that leads to the outlier data. The movement might also lead to a subject assuming a new location and not return to the same location. However, the consistency in the data after the artifact would not suggest that a potential new location has an effect.
My next question is whether or not there are movement correction approaches if indeed movement has occurred. Is it possible to identify individual acquisitions and delete them without disregarding the entire scan?
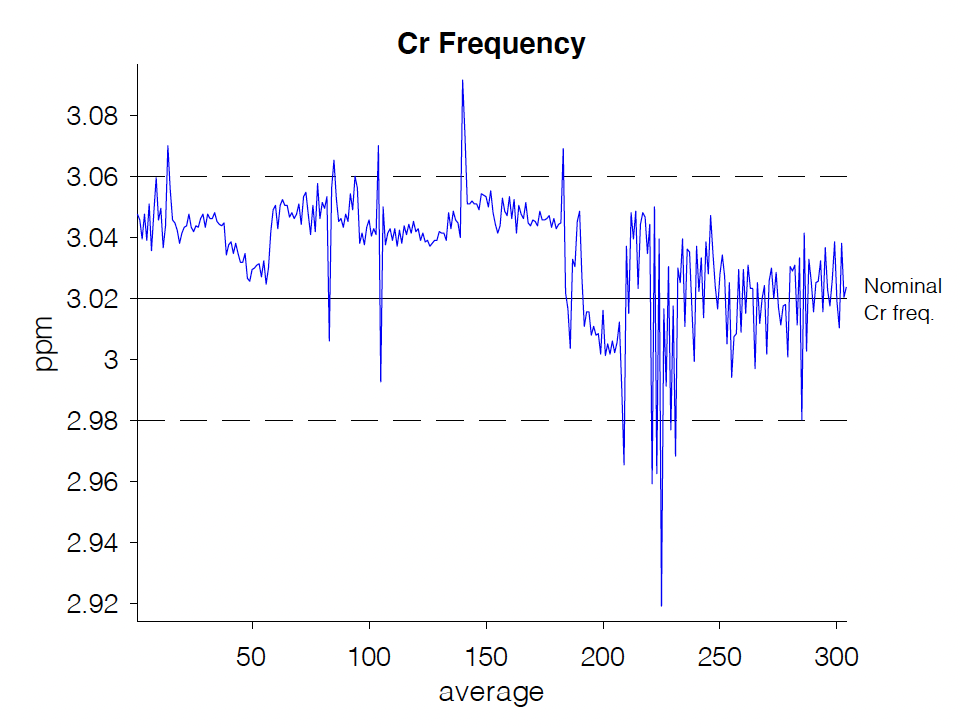
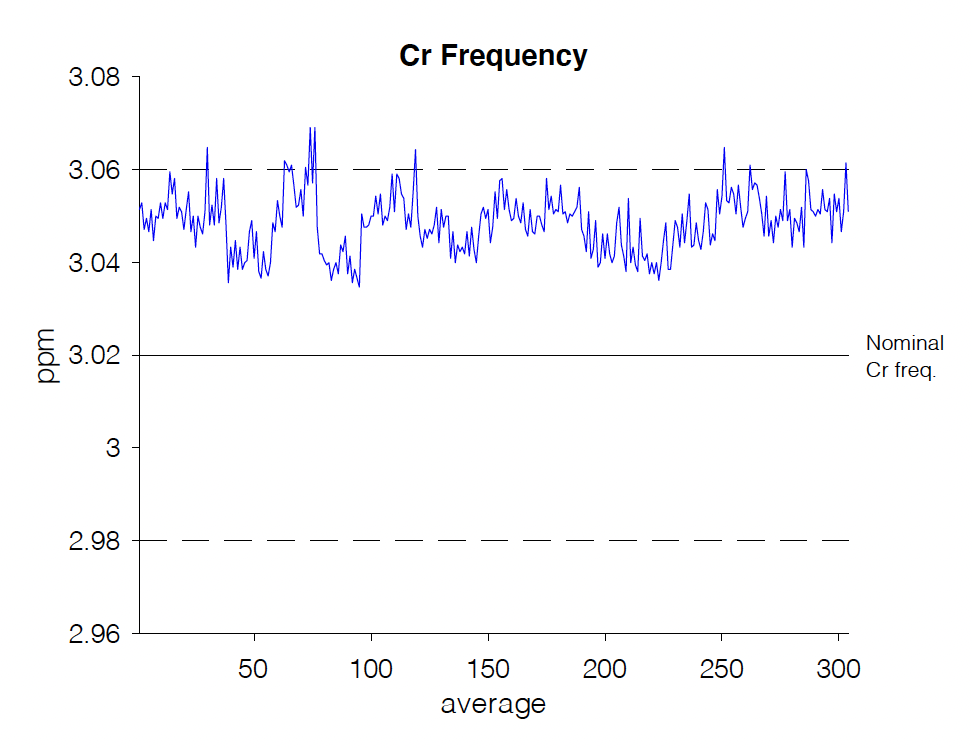
In Gannet, the Cr frequency plot in the upper right-hand side of the GannetLoad PDF output is a good way to assess if your subject moved. The giveaway for motion is the appearance of frequency “spikes” across the scan (the individual averages). This is an example:
There are real-time motion correction techniques (see this paper for current expert consensus on the topic), but these require either special hardware or obtaining custom sequences from developers.
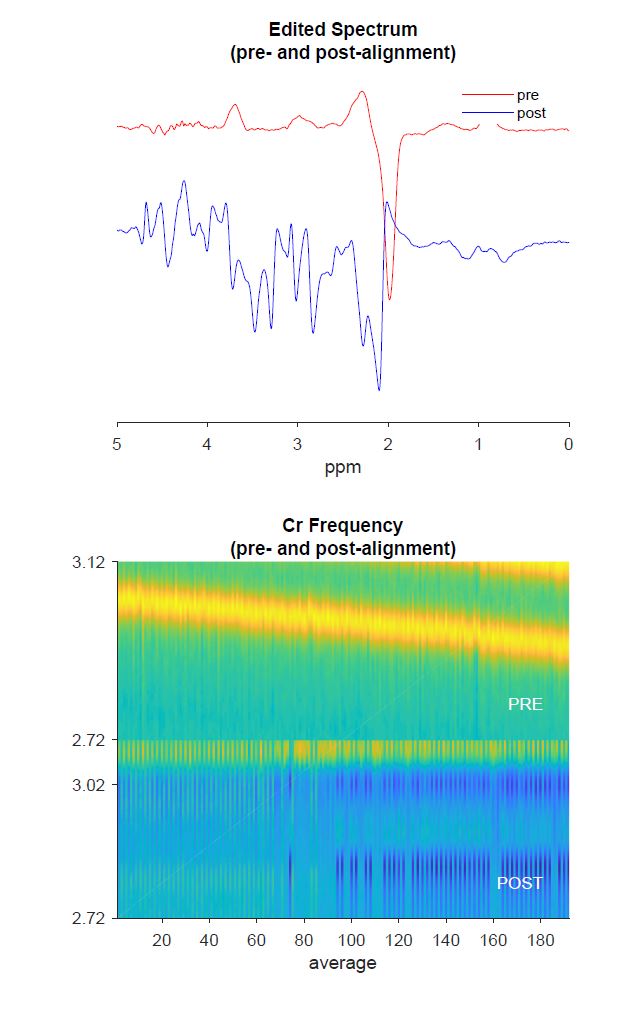
Retrospective correction methods for frequency/phase errors are numerous. Gannet gives you several options, but the default and recommended is robust spectral registration.
In terms of removing individual acquisitions, Gannet will by default use weighted averaging to down-weight averages of poor quality so that they contribute less to the entire scan. You can turn this off if you want, in which case, individual averages are removed based on their amount of frequency/phase error based on all frequency/phase offsets in the scan (similar to the method described at the bottom of p. 1447 of the Gannet paper).
I should clarify: The Cr frequency plot only appears for HERMES or GSH-edited MEGA-PRESS. For all other scans, it will be the water frequency. But the idea of frequency “spikes” representing motion still applies.
I’m using Gannet 3.1. so far I have processed several data using this version, no issue. But, I got this issue in one data. When I tried Gannet 3.0, I got a good fitting.