I would like to ask for some guidance on interpreting Osprey quantitative results. I have two questions:
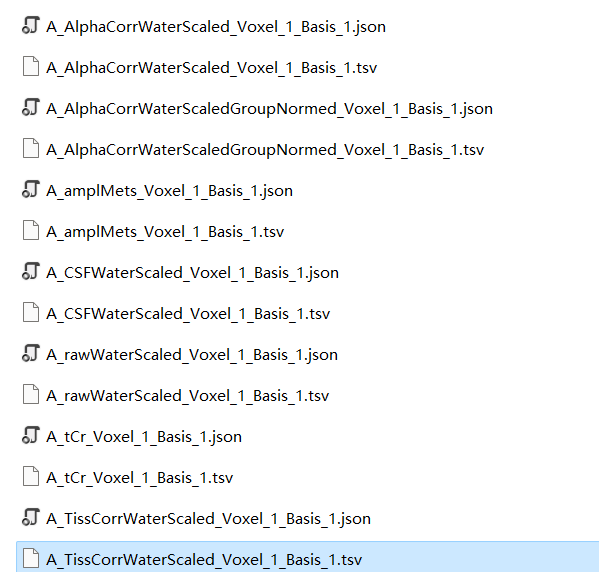
The quantitative results involve multiple corrections for concentrations, leading to different values. Which value should be primarily used for statistical analysis?
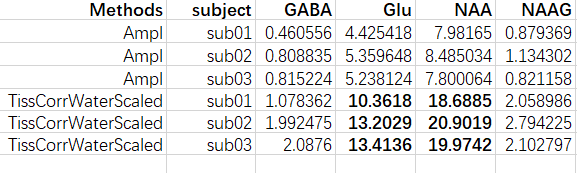
After tissue correction, the concentration of NAA reaches up to 20 mM/L, while literature reports suggest results around 10 mM/L. Is this concentration result acceptable, or could there be an issue with my quantification parameters?
This depends a bit on your subject group and study design. A recent consensus recommendation [section 4.1] discusses some of the approaches; see also my comment on the different alpha corrected values here.
In many cases, one of the tissue or alpha-corrected water-scaled variants is likely to be a good choice. If using tissue correction without alpha correction, you should check for any confound relating to tissue content (grey matter fraction); in principle alpha correction should reduce the risk of such a confound, at least where the underlying assumptions hold.
These NAA values do appear to be on the high side, at the same time your GABA (GABA+?) values look more reasonable; could you elaborate on your scanner/sequence configuration, voxel location, and maybe show a sample fit?