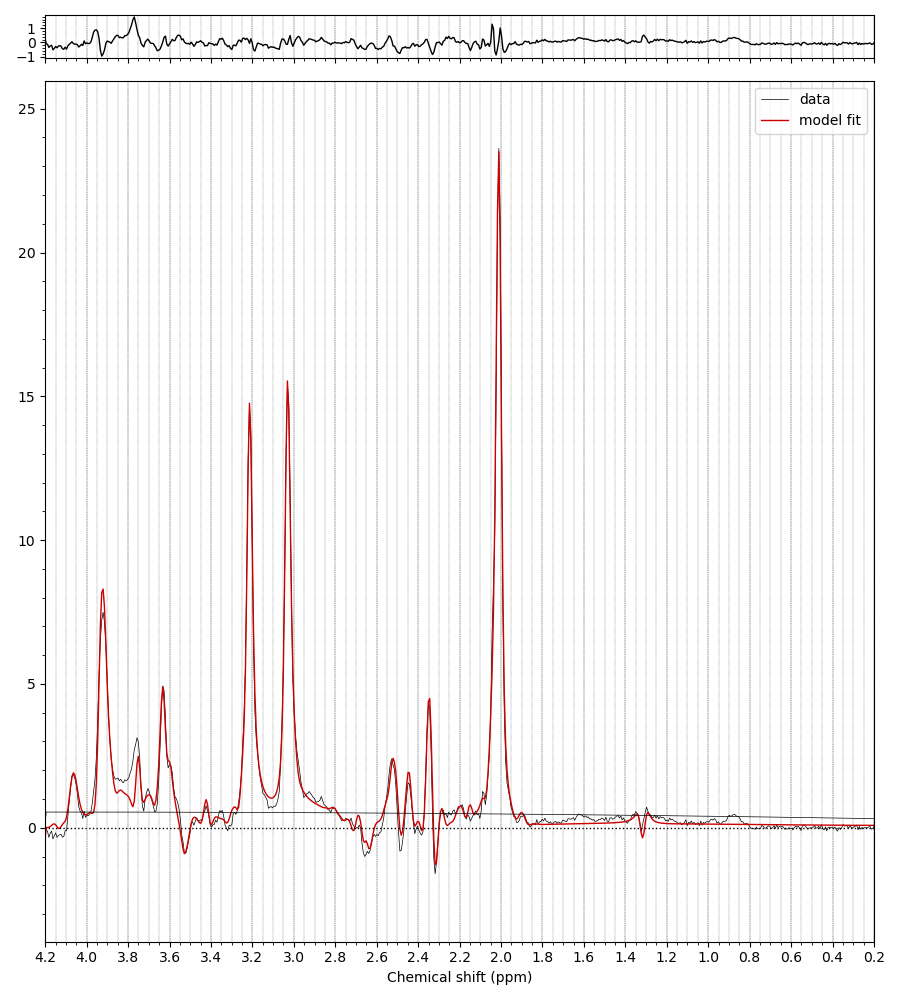
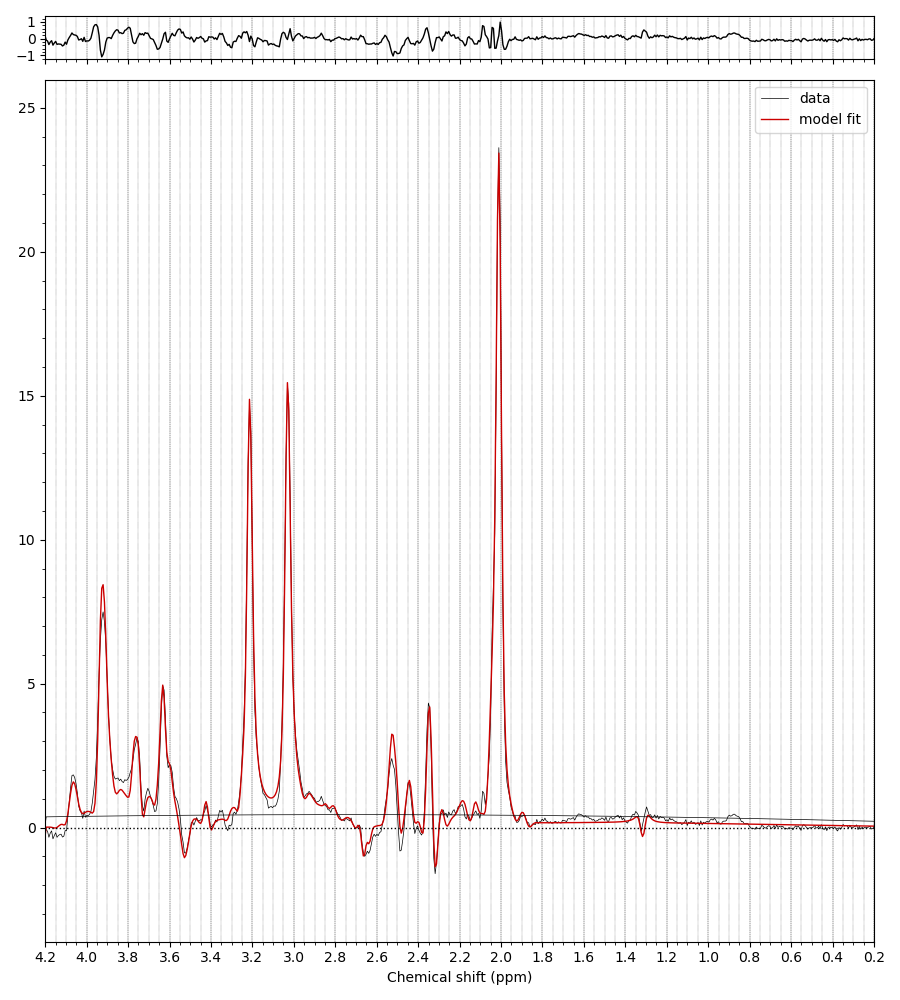
I’ve got some high quality TE = 80 ms data from some collaborators. In the basis set I initially received with the data the signal is modelled very nicely except in the 3.77 region (and the 3.9 Cr peak).
It was suggested that this basis set was missing GSH, with the Glycine moiety singlet accounting for the missing peak. I tried fitting with this, and indeed the fitting is then better in that region, but only with much worse fitting around the NAA multiplets at 2.5 ppm, because of the Glutamate moiety multiplet of GSH at 2.54-ish ppm.
Any thoughts of what is going on? Is that missing peak at 3.77 really GSH, or is there some other metabolite we aren’t considering. Healthy participant at 7T. Basis set contains:
Asc
Asp
Cr
GABA
Glc
Gln
Glu
GPC
GSH
Lac
mI
NAA
NAAG
PCh
PCr
sI
Tau
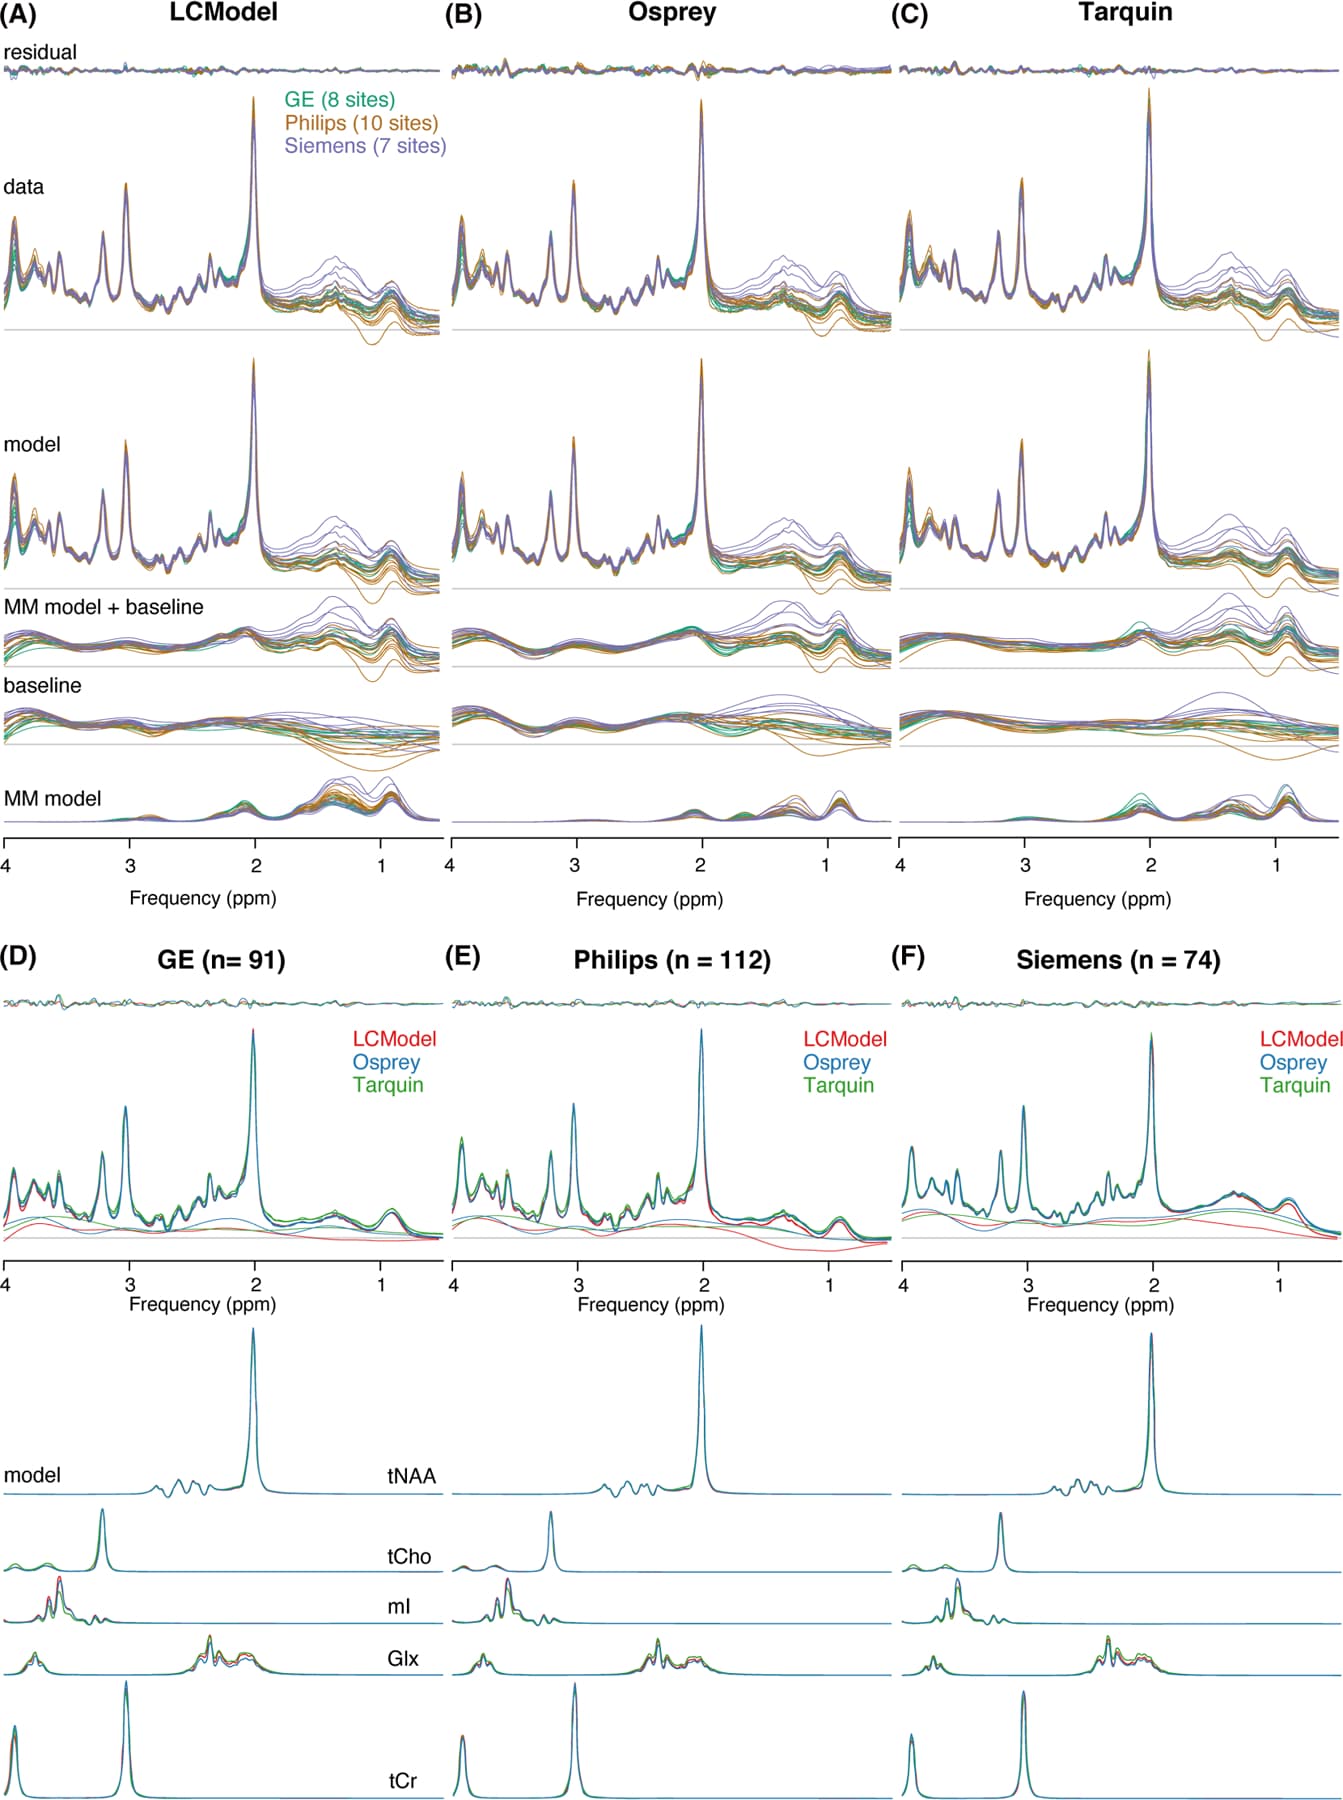
I initially suspected that something might be wrong with the spin system definition, but LCModel handles that region relatively gracefully. There is an MM resonance in that region that clearly shows up in all measured MM data I’ve seen, but is unaccounted for in the default MM parametrization in LCModel. It’s possible that the LCModel baseline model is better at reconciling this heavily overlapped region than Osprey or Tarquin, both of which are a little more rigid.
You probably don’t include any MMs in this mid-TE data at all, do you? Could an MM36 peak solve it?
That’s a quartet - Ala also has a doublet at ~1.5 ppm, not sure I see a lot of signal there that would be consistent with Ala fitting a substantial bit of the 3.77 ppm peak in these data here.
@Meredith I think that Alanine peak is a quartet with quite strong scalar coupling, so I don’t think it will really match what looks like (in the residual) a singlet peak.
@admin Why do you think the mI issue isn’t something wrong in the spin system definition? I regularly now shift the mI basis -0.01 ppm and get much nicer fits with it. E.g. here it really matches the peak shapes.
I think LCModel just gets away with it due to the very high flexibility of the model.
I’ll definitely have a look at the MM idea. However, we can just about see the 0.9 MMs here so unless the MM36 peak is very well defined, I’d be somewhat surprised.
Well… certainly possible that the spin system is off. We should ask Ivan Tkac But Tarquin and Osprey also both allow individual metabolites to shift a little, so it shouldn’t be a problem.
The other thought I had was… do you have a negative CrCH2 correction term at 3.9 ppm to account for different relaxation rates (or a water suppression tail eating in there)? There could be an interaction between the 3.9 ppm Cr peak constraining the 3 ppm Cr peak that might give the GSH too little space to breathe… what are the GSH estimates you get if you include it?