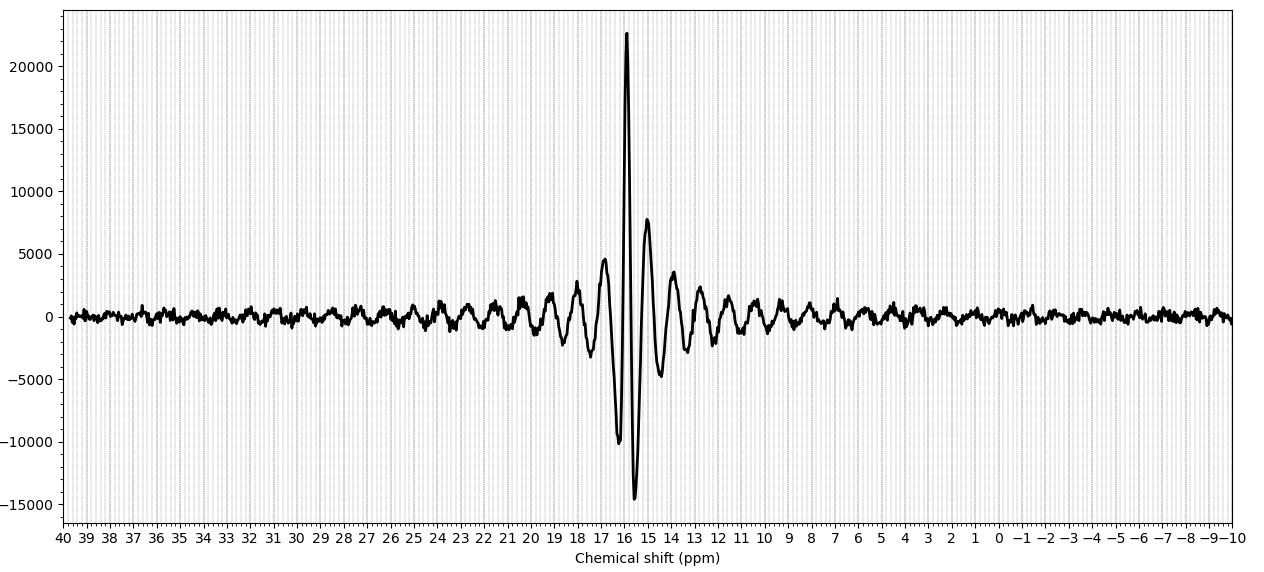
I manually converted our Bruker 13C spectra into NIfTI-MRS format and try loading it in FSL-MRS by mrs_tools vis NSPECT.nii.gz --ppmlim -10 40
What made me puzzled is, why does spectra in frequency domain have negative values? Shouldn’t it be similar to plot(abs(fft(data(:)))) in matlab?
This is a urea phantom. The peak ppm should be around 164. Why does it occur at 16 in FSL-MRS? I’m just wondering what mrs_tools vis actually does before displaying the spectra.
HI @zui,
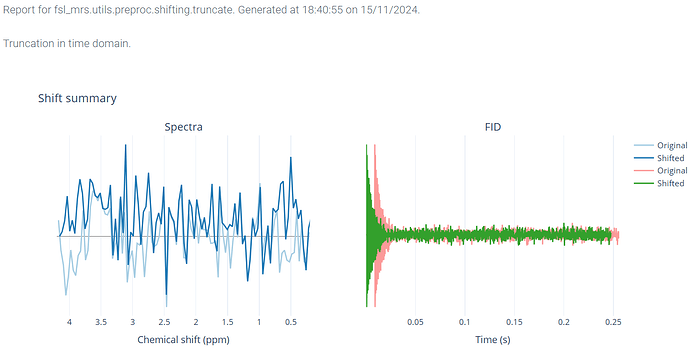
The ppm is dependent on what the bandwidth/dwelltime, central frequency and nucleus are set to in the header. What is the output of mrs_tools info NSPECT.nii.gz? The view is of the real part of the data, not the absolute. It is roughly equivalent to plot(real(fftshift(fft(data(:)))) in matlab. I think the baseline roll you can see will be due to the FID having a substantial number of extra points in the time domain before the centre of the echo. From memory Bruker has a default of something like 68 points (though I might be wrong). What do you see in the html report generated if you run fsl_mrs_proc truncate --file NSPECT.nii.gz --points -68 --pos first --output . --filename truncated -r?
Thank you so much for your reply!
$ mrs_tools info NSPECT.nii.gz
File NSPECT.nii.gz (/home/nmr/Projects/NIfTI_MRS_converter/output)
NIfTI-MRS version 0.9
Data shape (1, 1, 1, 2048, 1, 10)
Dimension tags: ['DIM_COIL', 'DIM_DYN', None]
Spectrometer Frequency: 100.679124582065 MHz
Dwelltime (Spectral bandwidth): 1.250E-04 s (8000 Hz)
Nucleus: 13C
Field Strength: 9.40 T
Ok, that truncation step looks about right (Though it seems that the processing tools are somewhere that 1H is still assumed, and so the left hand plot is fairly useless.)
Is 8000 Hz the expected bandwidth? Does this phantom only contain urea? If so there should only a be a single peak. How do you set your central / imaging frequency? Is it on the urea peak or some other method?
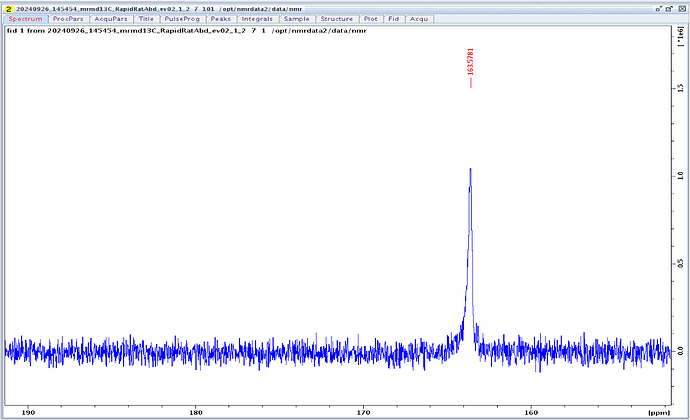
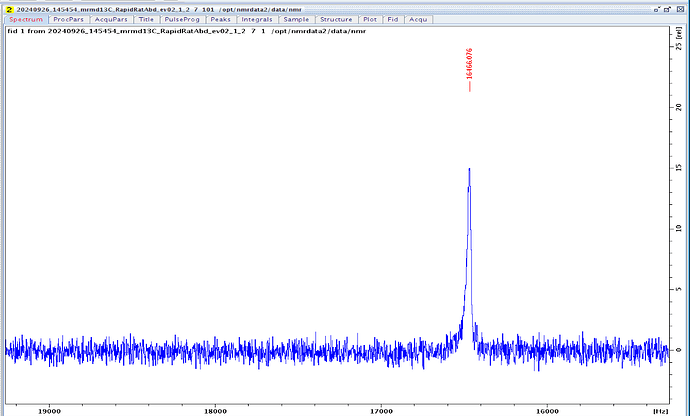
Hi, thanks for your reply. Here is the spectrum displayed in TopSpin (after
efp;apk).Actually I’m quite confused about “Spectral Width” and “Bandwidth” in various contexts. The dwell time is right. \frac 1 {DwellTime}=8000 Hz,\frac 1 2 \frac 1 {DwellTime}=4000 Hz
And I have another question in mind. The sampling rate is 8000 Hz, so the highest frequency that can be captured should be 4000 Hz, according to Nyquest Sampling Theorem. However, the Larmor frequency of 13C in urea at 9.4T is 16466 Hz, much higher than 4000 Hz. How is this possible? (Sorry if this question is too basic)
The panthom has only urea and water. Central frequency is set to 171.5 ppm

I asked ChatGPT about the sampling question. It doesn’t seem very basic. Anyways now I roughly have an idea why that is possible.
Hi Zui,
you are measuring complex points. So you can distinguish between positive and negative frequencies. The middle of your spectrum is not at 0 Hz, but was determined by you (171.5ppm or 17266 Hz). Frequencies above the center are positive and frequencies below the center negative. Because of the ability to distinguish between negative and positive frequencies,
your bandwidth is two times the Nyquist frequency: BW = 2 * Nyquist frequency = 2* 1//(2* dwell time) = 1/dwell time. For a dwell time of 1,25e-4 s, you therefore get a bandwidth of 8000 Hz (compare mrs_tools). In this example, your spectrum is from 13266 Hz to 21266 Hz (middle 17266 Hz). However, I can’t explain why you have a bandwidth of 4000 Hz in your screenshot (no quadrature detection, remove oversampling/half of the spectrum…!?).
I hope I was at least able to answer your question, why you can detect your Urea peak.
Best,
Heiner
Thanks for providing a clue.
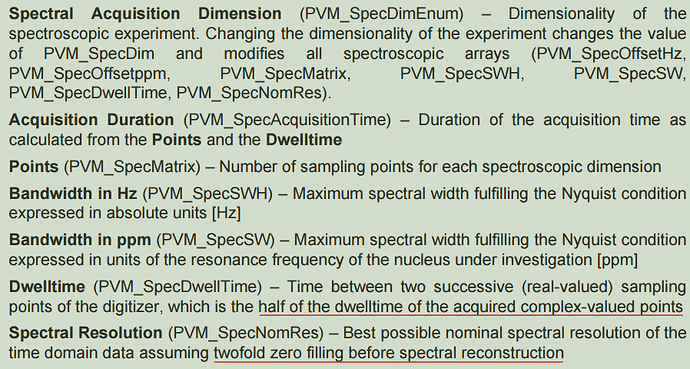
I found in ParaVision documentation that “dwell time” is half of the real dwell time. Actually the dwell time should be 250 us, instead of 125 us.
Update: dwell time was wrong. It should be 250 us, rather than 125 us.
