I’m relatively new to MRS so please forgive me if this is a silly question.
I’m trying to calculate absolute concentration of metabolites utilising the equation by Near et al. 2020. I have obtained values for most of the variables in the equation, however I am stuck on RM and NM.
I am trying to calculate RM for GM and WM but I need to obtain [M]GM/WM. I have read the supporting information from Near et al. 2020 but there doesn’t appear to be a formula to calculate it. Is this something I need to obtain from the scanner?
Are there any citable documents quantifying the number of metabolite protons contributing to the signal (NM), for each metabolite?
[M]_GM/[M]_WM has to be taken from the literature. For example, for GABA, this ratio is approx. 2:1 (see, e.g., https://doi.org/10.1002/nbm.3622). We have set this ratio for some other metabolites in Gannet that you may refer to.
I use Govindaraju et al.'s excellent paper from 2000 for this.
Regarding R_M_GM and R_M_WM: Given the size of MRS voxels, getting pure GM and WM voxels to (accurately) measure metabolite relaxation times in GM and WM is not feasible (well, maybe not for WM…). So care must be taken applying these parameters. But perhaps @PGMM has thoughts on this. I guess in the end, all of these parameters are approximations anyway
Thank you so much for your prompt response! And thank you for all the cited papers and code in Gannet - this has been a massive help!
I have attempted the full calculation but I’m still not getting the correct value. As an example, I calculated the value for NAA, and I got 0.0121. I’m thinking this could be something related to the units (i.e. it looks like the value may be out by an order of 1000) but I can’t figure out where it is going wrong.
I have attached a word doc of the original equation and worked example for one participant’s NAA concentration MRS Absolute Values Working Sheet.docx (32.9 KB)
. Is there anything that sticks out as incorrect to you?
As you’ve already correctly stated, your equation is correct, but it is producing a measure in molar concentration (M) (because of the [H2O]_molar parameter). You just need to multiply the water concentration by 1000 to obtain the millimolar concentration (mM).
Also, I see that you’ve set R_M as 1. You should definitely still apply a metabolite relaxation correction. My approach is to take the average of GM and WM estimates if a paper reports GM and WM metabolite relaxation corrections. Such that:
R_M = exp(–TE/T2_M) * [1 – exp(–TR/T1_M)]
My previous comment was just about applying this relaxation for GM and WM separately.
Oh wow thanks for picking that up regarding the (M) to (mM). And thanks for also noticing R_M. I used the equation you suggested (after averaging the relaxation scaling factor for GM and WM) and I got 12.07. This is much better!
I’m now trying to calculate the absolute concentration for myo-inositol (3.61ppm). I read the paper you suggested from Govindaraju et al. and skimmed through your code in Gannet but I cannot find the number of protons contributing to the signal. I attempted to use 6 protons in the equation, however this gave me a value of 1.10 which seems too low.
Use 2 protons instead. Although there are six hydrogen (1H) protons in the myo-inositol (mI) molecule, you should only count the 1H protons that contribute to the mI signal you are fitting (in this case, the 3.6 resonance). In Govindaraju et al., this is 4^CH and 6^CH.
Correction for number of protons is only necessary if you integrate signal areas. They are intrinsically accounted for when using measured or correctly simulated basis sets in linear-combination modeling.
AMARES complicates things a little further - that algorithm essentially fits the spectrum with a relatively agnostic set of peaks. Assigning them to individual metabolites becomes really difficult if there is substantial overlap between the metabolites. Yes, you would need to correct the signal areas for the number of protons in that case - it will just be difficult to tell which peak that AMARES finds arises from which particular moiety (if this assignment is at all possible).
I would generally only use AMARES for sparse spectra, i.e., those with a low number of clearly separated signals (e.g., phosphorus spectra or spectral editing). Linear-combination modeling allows you to inject a greater amount of prior knowledge into the analysis.
Do you have an example output model plot that you could share here?
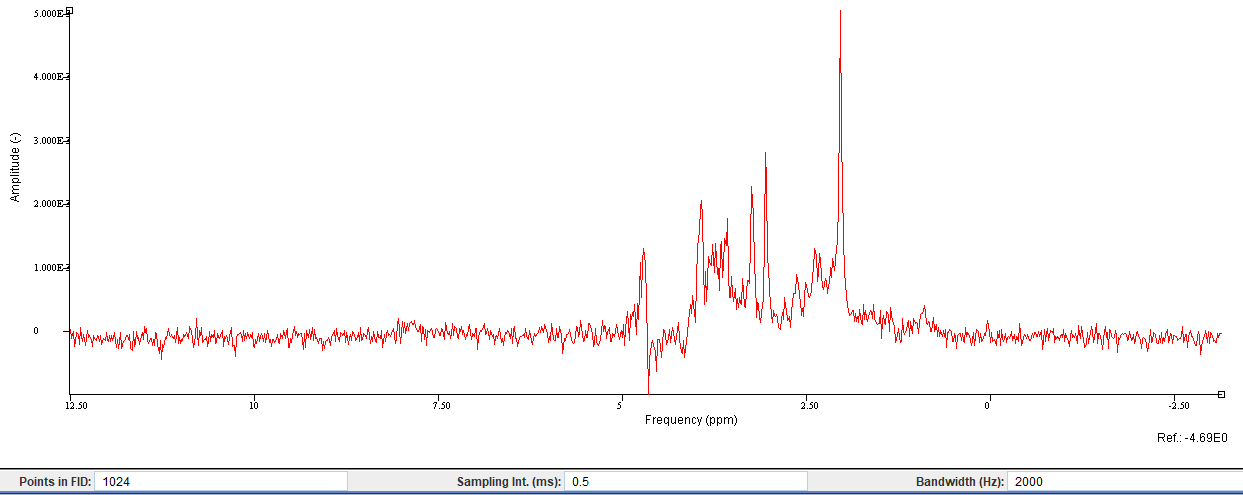
Data quality looks fine, but yes, this is a short-TE spectrum with lots of overlap between metabolites - I would recommend linear-combination modeling here (not just my opinion, but expert consensus).
I’d be curious to see how you have previously derived metabolite levels from an AMARES fit here. Do you have a fit example? And how did you assign metabolites to the peaks - especially where there is overlap?
Thanks again Georg! I really appreciate your help on this and I’ll look into using linear combination modelling instead.
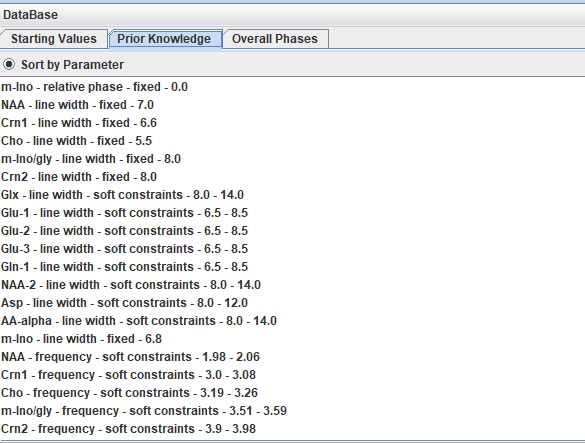
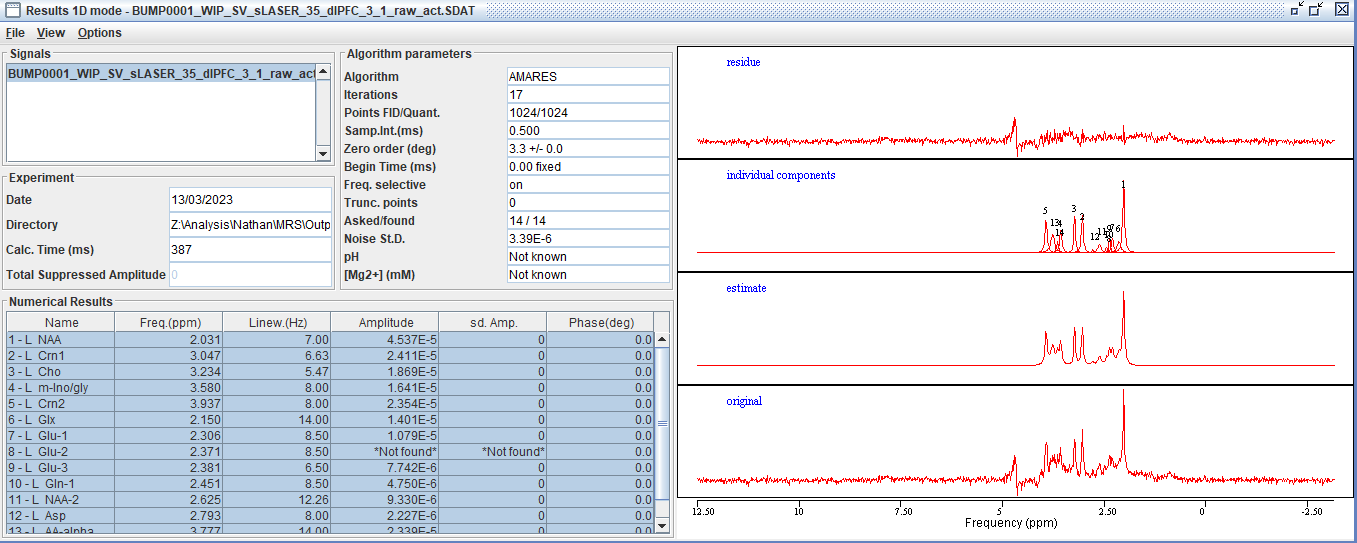
I used a Lorentzian line shape and prior knowledge. As an example, 14 peaks were added as starting values, followed by prior knowledge of the linewidth, frequency, etc (screenshot below).
Right - this illustrates the problem pretty nicely, because, for example, the different signals that make up the Glu signal have different amplitudes; then there’s Gln in there, but also an entirely separate Glx signal. It is not clear at all how you would report the results. In addition, you are not accounting at all for the underlying macromolecular signal.
I would strongly recommend using a linear-combination modeling approach. There’s a lot of software out there that can accomplish what you need (and most include the tissue correction stuff that you have devised).
We maintain the Osprey software package in MATLAB that optionally allows you to interface directly with built-in LCModel binaries if you wish. There’s also FSL-MRS and spant, which are both fantastic full end-to-end options in Python and R, respectively.