Dear Community,
I would appreciate your help in creating a model spectrum basis set for LCModel. I’m working on quantifying 7T STEAM 1H-MR spectra from the brain using LCModel and have simulated a custom basis set containing 22 metabolites using the FID-A tools. Additionally, I extended this basis set with a macromolecule (MM) model generated from a publicly available in vivo dataset.
However, when applying this basis set to an in vivo spectrum, I encounter the error message “AREABA 1”, which I have not been able to resolve so far.
Under the link (password: brB3jZaY), I’ve provided all relevant files used in the analysis (alternatively, you can also download the required data from the attachment):
The basis set file: steam_7T_TE6.BASIS
The raw file of the in vivo spectrum: ~/Raw/Fasting_Sub01_20241007_1150_PCC_Met.RAW
The resulting output files: ~/Results/
The LCModel control file: ~/Control/Fasting_Sub01_20241007_1150_PCC_Met.control
It’s worth noting that the same in vivo dataset was successfully analyzed using a different publicly available basis set, without producing any errors.
I would be grateful for any suggestions on what might have caused the “AREABA 1” error and what specific aspects should be considered when simulating or generating custom basis sets for LCModel.
Thank you very much in advance!
Alexander FilesToSend.zip (2.1 MB)
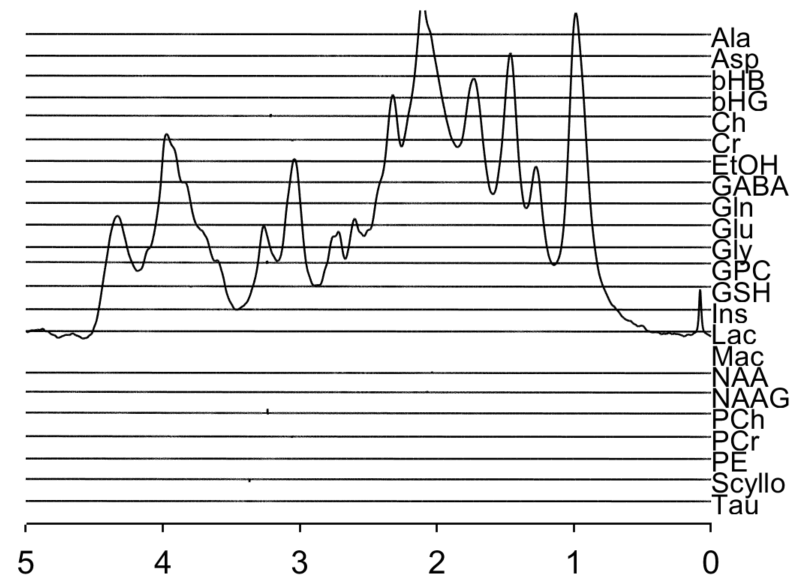
I just took a quick look at your basis set. First of all, I think you should scale down the Mac basis function so that it’s roughly on the same ‘order of magnitude’ as the metabolites:
This can really trip up the ifft which LCModel does internally because it operates on the time-domain signals. I suppose this leads to a lot of the weird stuff you see going on in the metabolite-specific LCModel plots. Each of them seems to have a bunch of signals where they shouldn’t, the metabolite-specific baseline (red) doesn’t follow the overall baseline estimate (thin grey), indicating some odd phase rolling behavior.
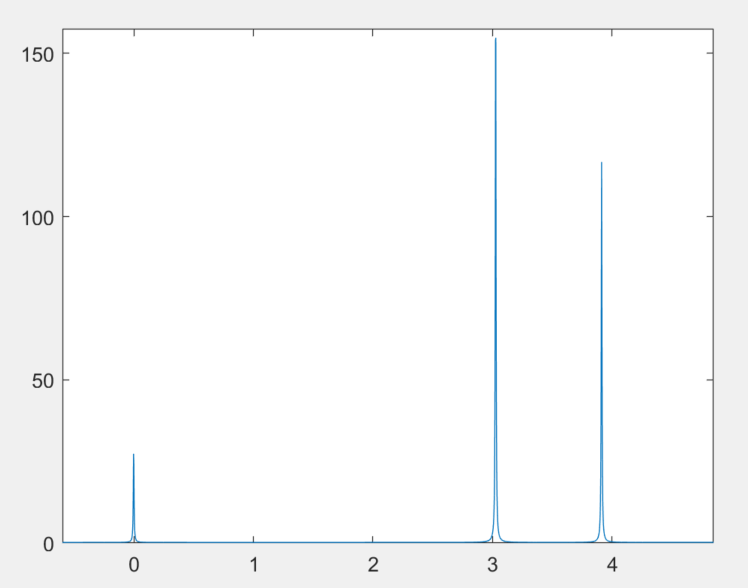
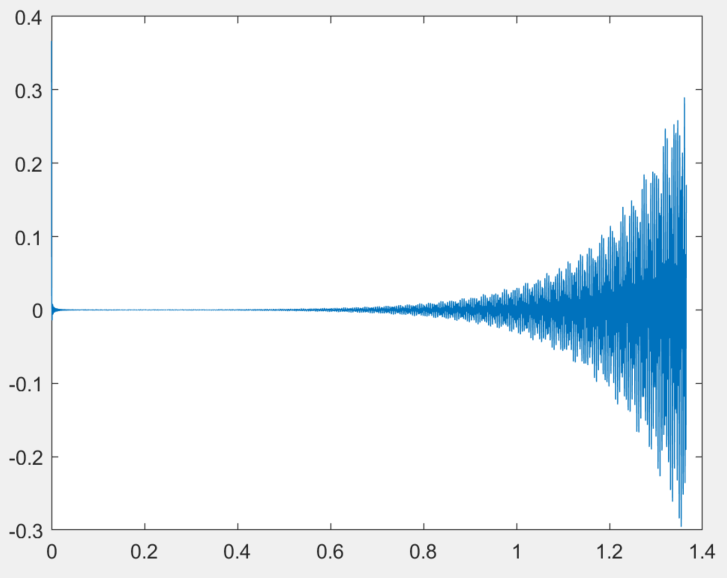
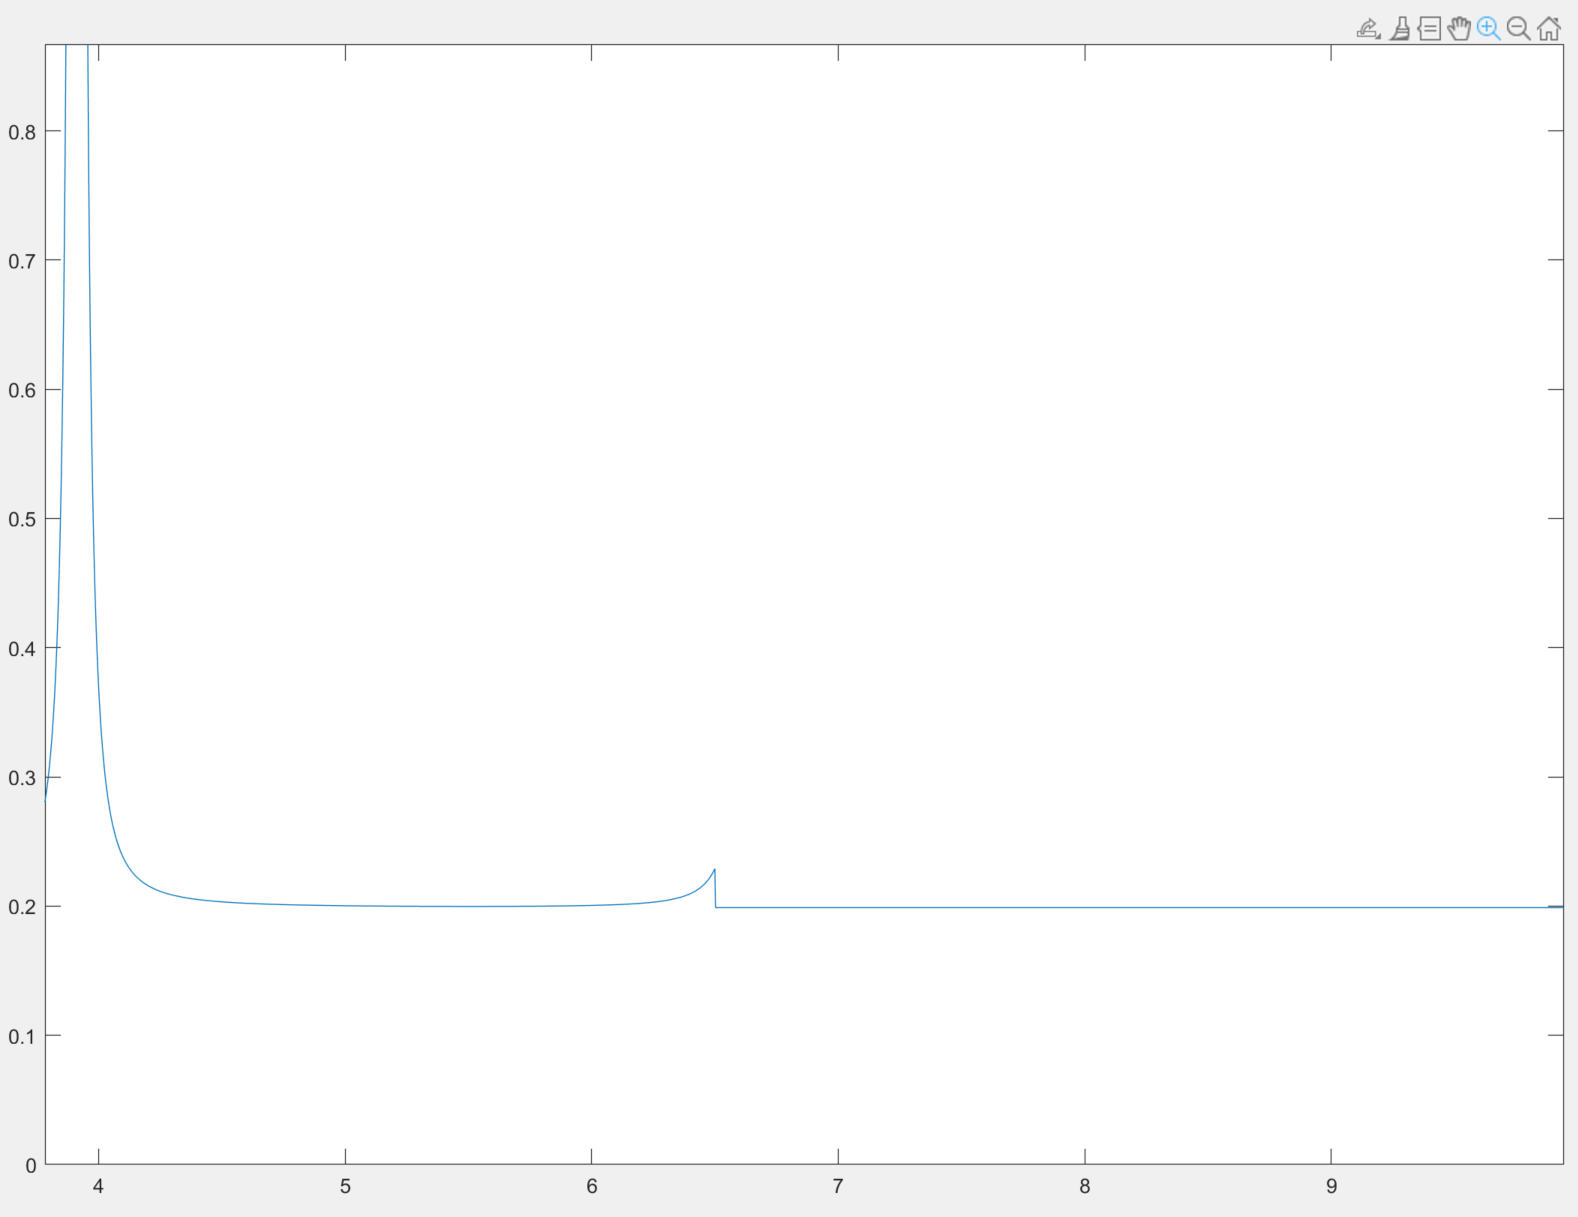
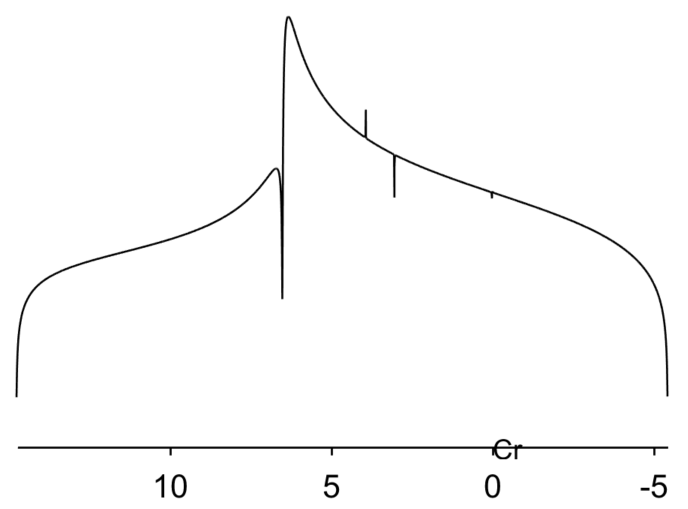
Indeed, if I do the ifft on the basis set, apply some zero-filling and line-broadening, and then plot the fft of that again, I’m seeing some really odd stuff:
Hi Georg,
thank you very much for the insights, explanations, and valuable suggestions! I need to go through it all in more detail myself first.
In the meantime, I’m sharing here the scripts (directory: ~/Scrpts_MakeLCMbasis) that I use to simulate basis sets for the STEAM sequence. The main script is Script_Simulate_LcmBasisSet.m, which:
Defines all necessary directories, sequence parameters, and metabolite models
Simulates model spectra using the FID-A toolbox (SimulateSpectraModels.m)
Saves the simulated models (as .mat files) into a .BASIS file formatted for LCModel (Make_LcmBasisSet.m)
You’ll need to define the root directory at the beginning of Script_Simulate_LcmBasisSet.m.
The model spectra generated with this script can be found in ~/LcmBasisSet_Simulation/fidA_SimulatedModels. The corresponding .BASIS file is also included under ~/LcmBasisSet_Simulation/LcmBasisSet. Scrpts_MakeLCMbasis.zip (7.8 KB)
Thanks in advance for the discussion!
Alex