MEGA-PRESS Study Design Help

Dear Experts,

I have been piloting the Siemens (Scanner: Prisma; Software version: VE11C) MEGAPRESS (859G WIP) for a few months now using Osprey for processing. Recently, I decided to run the sequence in the PCC to check that all my sequence parameters are correct and that I get the desired result. I believe acquisition in the PCC looks as expected, but its the acquisition in the mPFC or any frontal region (including ACC) that’s giving me an issue.

For my most recent data I also tried the three different fitting algorithms (Default:RobSpecReg RestrSpecReg and, ProbSpecReg) and I believe the default fits best.

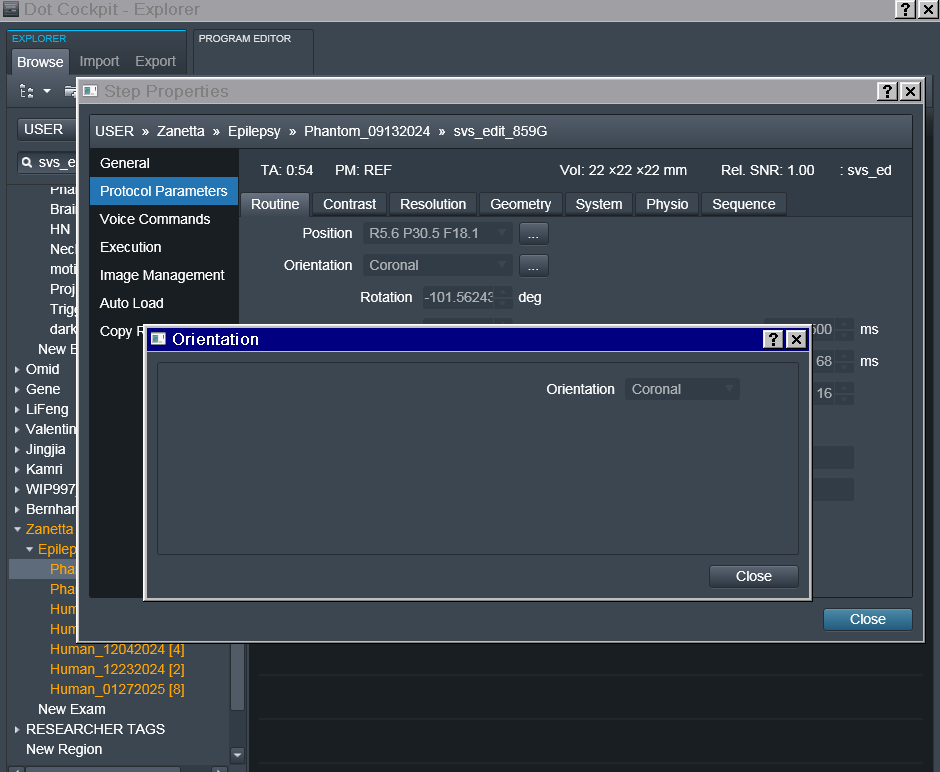
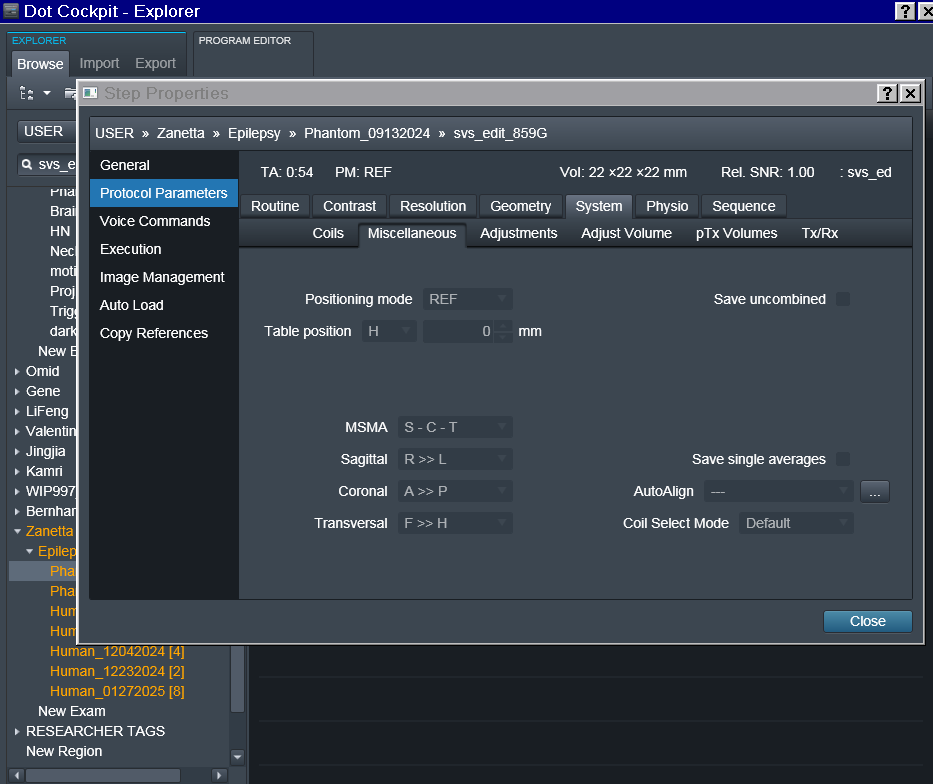
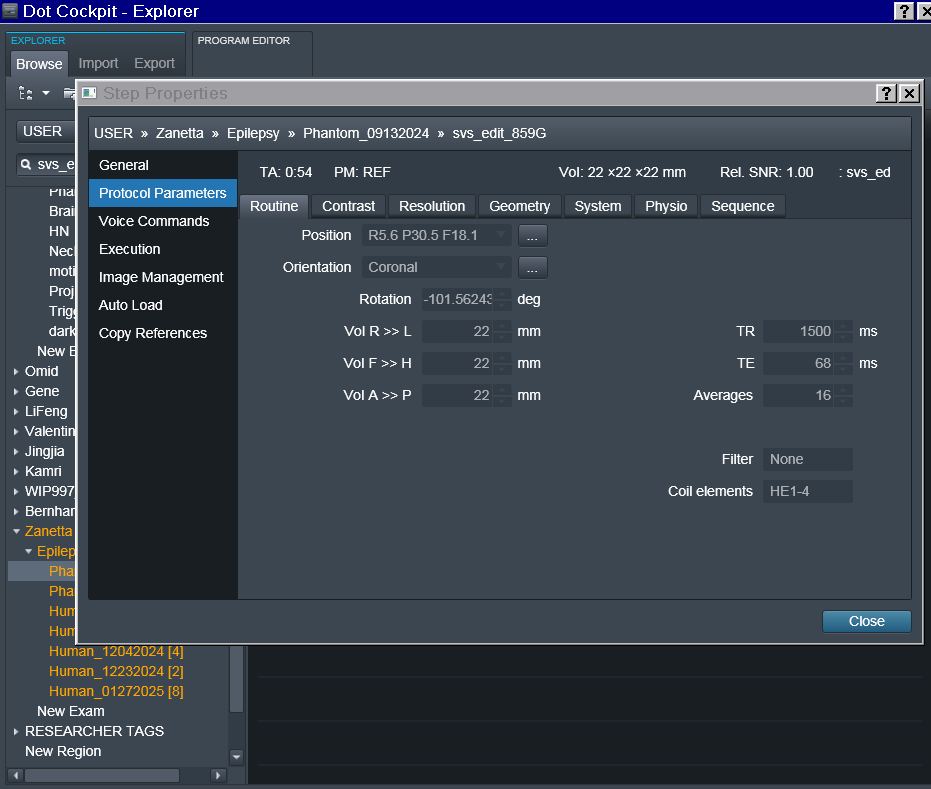
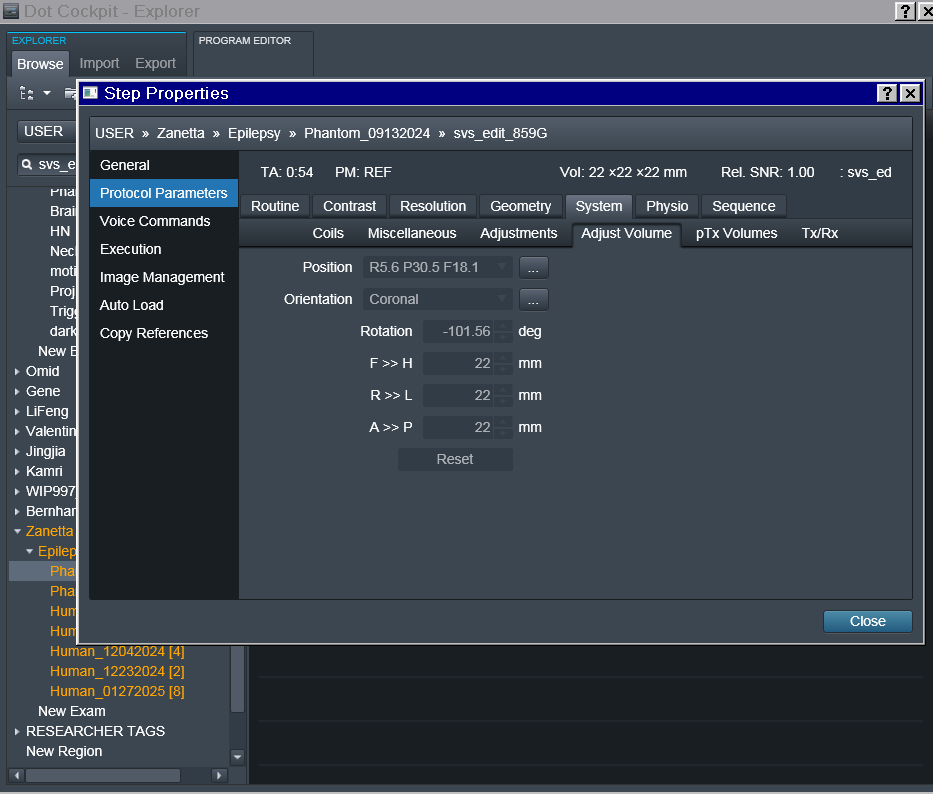
In the power point linked here I have included details regarding each acquisition, voxel localization, chemical shift PDFs (only for the RobSpecReg as the chemical shift PDFs for the other fittings were very similar), and the metab fit plots for each fit. The metab fit plots are generated using eddy correction with the water reference scan. I have also attached the entire acquisition protocol. (note: the last two acquisitions are both localized to the mPFC, I just mistakenly left the “PCC” naming during the scan.)

The KC Edit acquisition was one used by other researchers in my department, so I just wanted to test it out to see if I get good results.

For SVS Edit 1 & 2, I went off of another post on MRS hub to optimize the parameters. I think these two acquisitions are quite comparable. Ideally I would use a shorter TR and # of averages in my final acquisition as I need to decrease my scan time as much as possible.

SVS Edit 3 is exactly like SVS Edit 2 but just localized in the mPFC. This is where I struggle the most and don’t know what to do in order to improve the fit. The chemical shift is of poor quality, the data is quite noisy.

I know there are a few other things that could be contributing to this noisy data (shim, motion). I did an interactive shim and got it down to 20.4 Hz in the mPFC. Admittedly, the other shims were below 14 Hz for the PCC/OCC, but it was simply not possible to go down to that value in the mPFC. This was also the last picture that I took, so perhaps there is some motion artifact here but I am not sure. Right before this image I acquired two PRESS sequences also in the mPFC and the data came out very clean.

I am unsure how to proceed. Ultimately, I need to localize in the frontal region and I wonder what else I can do to improve the data? Any and all suggestions would be highly appreciated. THANK YOU!

Regards,
Zanetta

Human_01272025.pdf (114.1 KB)

Hi Zanetta,

A couple thoughts:

  • Anything prefrontal/frontal tends to be more difficult to shim. What is your shim procedure before you go to the interactive shim? Some folks have recommended doing the regular GRE or brain shim three times in a row. If you have access to the CMRR spectro package, consider the FASTMAP/FASTESTMAP modules, which can give good results in tricky regions.
  • Shim is one thing, but another huge problem in your mPFC spectrum is an awful lot of the spurious echoes (high-frequency oscillations) that you see in your mPFC spectrum; they tend to occur a lot in tricky-to-shim regions. One thing you can experiment with to ameliorate that is the order and orientations of the slice-selective gradients (I believe that on the Siemens this is in Routine → Orientation, and I can’t recall the name of the other option, but it allows to try different orders - send a screenshot of the exam card tabs and I can take another look). See this thread and this paper.
  • Your SVS Edit 1 and 2 protocols in the OCC look good to me and have approximately what I consider good SNR (we typically tell people to measure for 10 mins in a 27-ml voxel at TR = 2 sec).
  • I would advise against going lower on TR (introduces T1 weighting to all of your signals), voxel size, or the number of transients. Yes, I know everyone wants to keep their scans as short as possible and measure in the smallest possible volume, but in order to measure GABA+ reliably, you can’t beat the laws of physics/SNR. I’d say your signals look just about acceptable in the KC protocol, but this operates the very lower end of what I usually recommend for SNR (the KC protocol is already at just about 40% of that size and 80% of that measurement duration, so your SNR is probably down to about 30% of what I’d let people start with). My advice is usually that it’s better to sacrifice one region of interest but at least get interpretable data rather than a bunch of noise.

For your Osprey analysis, the three algorithm choices you mention only pertain to the spectral alignment, not the modeling. Based on the initial three KC plots, RobSpecReg appears to be much better in aligning than RestrSpecReg, which gives massive subtraction artefacts in the GABA region.

You will definitely want to include modeling of the co-edited MM resonance at 3 ppm. This is more thoroughly explained in the documentation - we should probably add an example job file for TWIX data as well (you’re the second person this week that built from the example file for un-edited data and missed this crucial part), but you can find a good template in the Philips MEGA example. This will substantially improve the modeling of the 3-ppm signal compared to what you have now.

Specifically, add:

% Add macromolecule and lipid basis functions to the fit?
opts.fit.fitMM              = 1;                % OPTIONS:    - 0 (no)
                                                %             - 1 (yes, default)

% How do you want to model the co-edited macromolecules at 3 ppm for GABA-edited MRS?
opts.fit.coMM3              = '3to2MM';      % OPTIONS:    - {'3to2MM'} (default)
                                                %             - {'3to2MMsoft'}
                                                %             - {'1to1GABA'}
                                                %             - {'1to1GABAsoft'}
                                                %             - {'freeGauss'}
                                                %             - {'fixedGauss'}
                                                %             - {'none'}

opts.fit.FWHMcoMM3          = 14;

You will then need to report the composite of GABA+macromolecules (GABA+, which is provided by OspreyQuantify), because GABA alone cannot be reliably estimated from a MEGA-PRESS experiment.

HTH,
Georg

1 Like

I just looked at your protocol PDF and found a few things worth fixing:

  • It was correct in some protocols but not others, but to be clear: For your water reference scans, you need to set the delta frequency (Sequence → Common) to 0 ppm to ensure that the water signal is co-localized with the metabolite scans (reverting the chemical shift displacement error).
  • You don’t need 16 water reference averages. One would be enough, 2 is good, 4 is plenty. Saves a couple second.
  • We’ve had very mixed experiences with the RFA feature (interleaved frequency adjustment), which some of our collaborators have reported to do more harm than good. If your scanner doesn’t drift that hard and/or you’re not running a bunch of gradient-heavy scans (e.g. DTI) in the half hour before your GABA MRS, you are probably fine turning that off.
1 Like

Hi Georg,

This is exceptional, thank you so much for the detailed suggestions I am beyond grateful! Its been quite the journey getting this project off the ground.

To respond to some of your points:

  1. For my shimming procedure I do the auto GRE shim 2x with a shim box larger than my volume (but not close to the edges of the brain etc.). I apply the autoshim, decrease the shim box size to match that of my VOI and then do an intershim where I manually change the first order shims to see if I can knock down the FWHM a few Hz. This has gotten me the best results thus far on my machine. I will look into the CMRR spectro package.
  2. In terms of the orientation, it is set to Coronal and greyed out so I can’t seem to change it. Screenshots of the exam card are attached.
  1. Ok it seems that sticking to a TR 2000 is the best option with voxel size 27 mm iso.
  2. I did in fact miss those lines of code. I added them and repeated the analysis. Results are here. However, should the resulting plots be labeled with “Gaba+” and not just “Gaba”? And my concern is that it quantifies a Gaba concentration of 0, even in the two svs protocols in the PCC. Attached is an example job file.
    jobTwix_invivo_megapress_859G_mPFC_MMRob_EXAMPLE.m (19.1 KB)
  3. Noted on the # of averages for the water ref scan as well as the delta frequency under Sequence → Common, it seems I missed it for the KC edit.
  4. So you suggest turning RFA off for all sequences? So far I have only turned it off for the water ref scan to achieve “RF OFF” water suppression. Otherwise when RFA is turned on, the only options for water suppression are “water sat.” or “weak water suppression.” This is a mostly clinical scanner so I am unsure if there are heavy duty scans run frequently on the machine. I will double check - thank you for the tip.

Thank you again for your prompt and detailed reply!
All the best,
Zanetta

Hi again,

To follow up - our scanner does run DTI quite often so it seems keeping RFA on would be best.

Glad it is helpful. More responses to your questions:

  1. Your shim procedures sound alright to me.
  2. Orientation parameters might only be modifiable once you actually have a participant in the scanner (the calculations for the exact sequence timing depend on weight).
  3. TR = 2 sec is quite common. Going to longer TRs is also fine as you’ll get signal back from T1 relaxation (with the added benefit that the need for correcting for T1 relaxation decreases). I think @erin.macmillan did the math on that a while ago in an ISMRM abstract.
  4. Yes, the quantity you report will have to be GABA+, not GABA. The two separate terms we have in Osprey (the GABA basis function and a parametrized MM basis function) both can assume large portions of the signal - as long as the model captures the full signal (which it didn’t in your initial plots but does now), reporting the composite is OK, they’re not separable (we’ve tried, see the supplementary materials in this paper).
  5. Great
  6. On RFA - I’d suggest you run some test scans where you drive the scanner heavily with a bunch of DTI scans and then acquire some MEGA-PRESS data during the cooling period. Drift behavior is highly scanner-dependent; if you’re lucky to have a low-drift scanner, it’s probably more advisable to turn RFA off (we’ve had collaborators complain years ago that RFA can actually make things worse as the frequency determination is not localized to the voxel, but rather to a slice). For the water reference scans, RFA wouldn’t make sense as they’ll be too short anyway.

edit: looking at your job file, consider choosing a larger spline knot spacing (in the same paper, we’ve arrived at the conclusion that 0.55 ppm was the best value among the three we tried)

Hi again,

Thank you for the follow up. I have just run a scan with your suggestions and the results are linked [here] (https://www.dropbox.com/scl/fi/bo1fv50pw5rhegt1m1jf5/Exp0009_DataSummary_MRSHUB.pptx?rlkey=lxjty39bk94hpvy5jz2k17tib&st=64747f63&dl=0) and the protocol is attached.
Human_02272025.pdf (92.6 KB)

These are also all the possible orientations on Siemens:

For this recent acquisition we only tried sagittal & coronal (as I was acquiring T>C>S or C>T>S in my previous (Exp0008) acquisition).

We also added 2 saturation bands (in the coronal and transverse planes), increased the water suppression bandwidth since the water signal was very large when we were checking during the scan, and tried RFA off.

I think the saturation bands, coronal orientation, and increasing water suppression BW marginally helped especially as compared to the megapress acquisition in the mPFC from my previous scan (linked: Exp0008, slides 8 + 9).

However, compared to my transverse acquisition in the PCC (Slides 4-7) for Exp0008 (with a water saturation BW of 50 and no saturation bands), the signal we just acquired still looks very noisy and with higher error. Moreover, when just adding saturation bands and changing orientation to coronal, the chemical shift was somewhat off.

I have another test scan coming up next Monday. Do you have any other suggestions to help streamline this?

Thank you again for your time and input, I think I am certainly moving in the right direction.

With gratitude,
Zanetta

Yeah, it’s just a tricky location after all, really. Another thing people have tried is shimming on the whole brain first with first-order shims only (with GRE or Brain) and then only shim the MRS volume with the higher-order shims. (I believe that’s in one of the linked threads above)

Other than that, try placing the sat bands (set to the frequency of water instead of lipids) very specifically over the sinuses i.e. behind the forehead and below the frontal lobe.

Did you see the gradient polarity settings? I believe they are these:


Try various permutations of RL, AP and FH (yes there are a lot of permutations to trial - you can shorten the acquisitions to see if one combination gets rid of the out-of-voxel echoes)

There’s not much else I can think of.

Not to be dramatic, but I could cry because I’m finally seeing some good data! Thank you so much :slight_smile:

I think 4 saturation bands, well spaced from the voxel, coronal orientation, and P >> A gradient polarity is the direction I’m heading in (slides 11-12). My only concern is that the GABA quantification is 0.0 for that acquisition relative to some of the other things we tried (but that produced noisier data).

My next step would be to increase the voxel size and perhaps try some other gradient polarity permutations before proceeding. What would you do if you had one more 2-hour test scan available to you?

Imaging protocol:
Human_03102025.pdf (112.7 KB)

Hi again,

I have run another test increasing voxel size, adding a 5th saturation band, trying to decrease # of avgs, and some more gradient changes (Exp0011). I did not get the most clean data as compared to Exp0010 (slides 11-12).

I’m unsure if it could be due to some early subject motion or if RFA off (this time) wasn’t helpful…

My biggest concern from both of these experiments was that even if I got a nice (or OK) looking spectrum, I either didn’t see a clear GABA peak or the GABA quantification was just 0. Could you please comment on this?

Thank you so much again!

Human_03222025.pdf (130.0 KB)

You always need to look at GABA + macromolecules as your outcome measure for MEGA-PRESS data, never just GABA. These two parts of the model cannot be reliably separated.

You can also try another model for the co-edited MMs - try '3to2MMsoft' instead of '3to2MM', that will decouple the estimation of the MM30 resonance from the MM09 one (but still maintain a soft constraint) and potentially assign a bit more of the edited signal to GABA (although again, in the end, it doesn’t really matter as long as most of the signal gets modelled).

Hello again,

I am using the co-edited MMs code as per your previous suggestion but I do not see a Gaba+ peak in my output. Here is the matlab script I am using for all of my processing
jobTwix_invivo_mega_waterdata.m (18.7 KB). Is “Gaba” supposed to get replaced with “Gaba+” in the PDF output?

Thank you!

No, but the output tables generated by OspreyQuantify have a GABA+ column which reports the composite from GABA and the co-edited MM signal.

I see, thank you. I have a few more questions for you please.

I guess my main concern is not seeing a GABA peak in some of these plots, even if there is a GABA+ value output. (1) How is that typically dealt with in terms of publishing? Or since there is no GABA+ peak in the output I shouldn’t worry about the GABA (w.o MM) peak itself shown in the pdfs?

I am attaching the output with 3to2MMsoft modeling. Visually I don’t see much of a difference. However, attached
GabaPlus_comp04102025.csv (592 Bytes)
is a table looking at the GABA+ values between 3to2MM and 3to2MMsoft. I pulled these from the diff1_rawWaterScaled_Voxel_1_Basis_1.tsv. (2) Is it best to use CSF water or raw water scaled when a water reference scan is acquired? It seems to have made a substantial difference for some of the acquisitions, mostly showing an increase in Gaba+ concentration other than for 1 picture. (3) You said it doesn’t really matter as long as most of the signal is modeled but how does one choose?

And on second thought, (4) it looks like the coronal orientation, PA + med-lat gradient encoding, 27 mmiso and 172 avgs (last slides) actually looks the best in terms of overall and separate spectra. Would you agree or there isn’t much of a difference between this and the first slides? I think the 5th saturation band does not add anything for us and we will revert to using 4. That seemed to be sufficient.

Thank you again for all your help!

  1. You just report GABA+, period - the GABA+ model consists of the two components for GABA and macromolecules, but only the sum is relevant. All that matters is that the model fits the entire signal, but it cannot reliably tell how much of either is needed for that.

  2. Use the TissCorr or TissCorrAlpha outputs. rawWaterScaled and CSFCorr do not contain the full tissue-specific relaxation correction information that is derived from the segmentation.

  3. See 2)

  4. I can’t quite tell what spectra you exactly want me to compare (there’s a lot by now) - please link the exact pdfs and slide numbers again.

Here are the two options to review.

Included is also the table comparing TissCorrwaterscaled output between the 3to2MM and 3to2MMsoft modeling. It seems a bit arbitrary, with 3to2MMsoft estimating mostly higher Gaba+ values (as you indicated).

Thank you again for taking the time to review and comment.