Hi Helge,
Thank you for your help! It was very helpful.
Regarding OspreyQuanity, I figured out how to adjust TE in osp_LoadDICOM and osp_LoadTwix. Also in OspreyQuality.m when I removed lines 594 and 595, it improved CSFWaterScaled results, which are now closer to the right range.
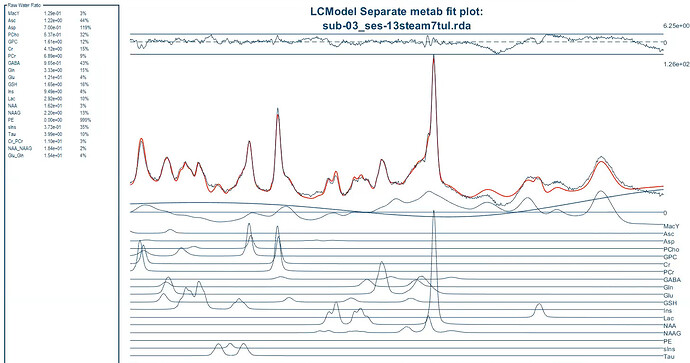
As for OspreyFit, I understand that you mentioned in the data with lipid contaminations the metabolite concentrations are higher and you found out because of tNAA values fluctuations. However, I’m not clear on the exact reason. For instance, in data with lipid contamination using STEAM, what’s the issue with scaling MM?
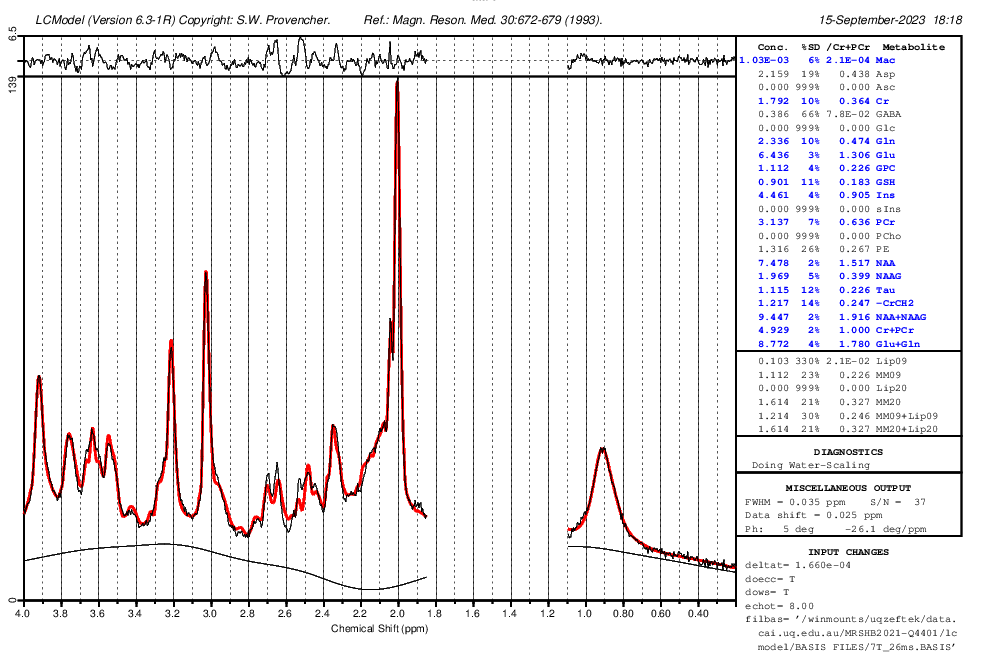
I’m using the basis set provided by Dinesh and Gosia, which includes measured macromolecules. In the control file, I set NSIMUL=0 and dkntmn=5, and I removed the chomit = ‘Mac’ command from the default Osprey control file. Because I didn’t create the basis set myself, I need help with the first and third solutions you suggested. Can you please explain how to do them and clarify the difference between these three solution? If there’s no difference, I attempted the second solution by using these commands: ppmgap(1,1) = 1.85 and ppmgap(2,1) = 1.1. However, I encountered an error in Osprey.
FATAL ERROR MYCONT 2. (Check LCModel Manual). ************************************************************************
*** FATAL ERROR MYCONT 2
This error occurred before the plot could be produced.
See the Diagnostics list in the LCModel Manual. ***
I tried the same command with LCModel, and it worked successfully.
If I implement the second solution for my data, given that we’re disregarding macromolecule (MM) concentrations within this gap, could this approach potentially impact the accuracy of the overall metabolite quantification?
Best,
Zeinab

