I am quite new to spectroscopy and have a few questions.
For TWIX data, I was able to run the whole process without any problems. However, my question would be how define which data needs to be discarded, how to find artifacts or outliers? Is there a good description somewhere how to evaluate the data?
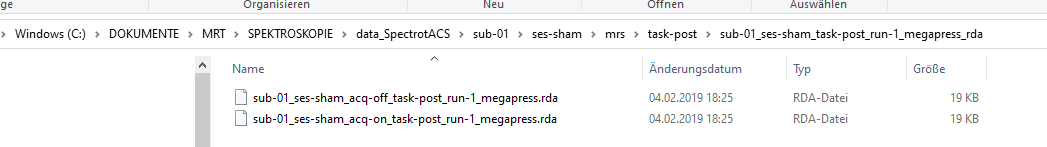
Unfortunately I only have twix data for 4 participants. The whole study was recorded 2 years ago (not from me) and they only find out that twix would be better at the end of the experiment. For all other 13 participants, I only had rda files. I had some problems loading the rda files into Osprey. I put ON / OFF and DIFF into one folder for each subject separately and loaded that one in the jobRDA file. I further modified the files(counter) variable that all three files were uploaded. But independet of the fact if one or all three were uploaded, there was an error in Matlab during the loading of the data.
It’s difficult to come up with hard cut-off exclusion criteria, and I tend to advise against that. If you’re looking for quantitative numbers, the SNR and FWHM (signal-to-noise ratio and linewidth) that Osprey returns are valuable indicators of data quality, as are the fit residuals. Generally, you want to see a fit model that agrees well with the data you’re trying to fit - gross modeling artefacts are a sure sign that something went wrong. In terms of artefacts, Roland Kreis’ artefact gallery is still a wonderful resource.
Don’t use the DIFF files at all when loading MEGA-PRESS data; just put the ON and OFF in the same folder. Let me know if that fixes your problems. (Needless to say that you need to keep a keen eye on subtraction artefacts with RDA data!)
We have something like that under development, but not quite ready for release yet (It’s certainly possible using existing FID-A functions!).
Has Helge been in touch with you about this particular problem? Can you share a screenshot of your folder organization and post the file specification sections of the job file you’ve been using?
thanks for getting back to this issue. Yes, Helge was also in touch. I found a solution to concatenate the different runs using the fid-a functions. Thus, this works now for the twix files.
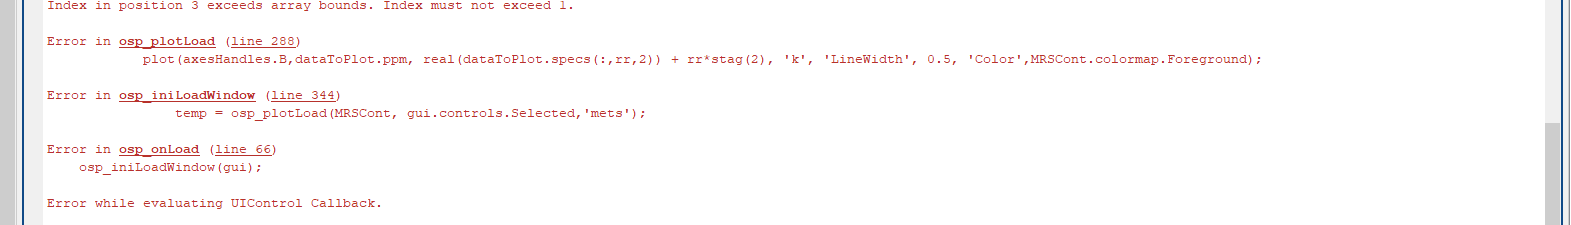
Still, I have the problems during loading the rda files, leading to the error message posted in my first comment.
The jobfile like this (sorry, I was not able to upload the .m file, thus I made a .doc out of it). To the original jobRDA file I added a task loop, since my data was a bit different structured to the example. But this loop works well with the twix files, thus, I am not sure if that is the problem.
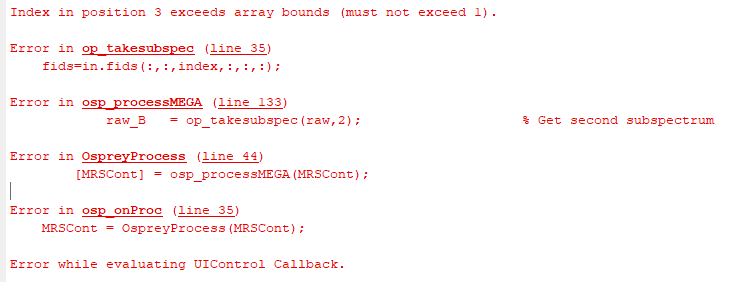
I tried to figure out where the problem is in my data. One problem could be solved (the one with the “fids”) mentioned in my second post.
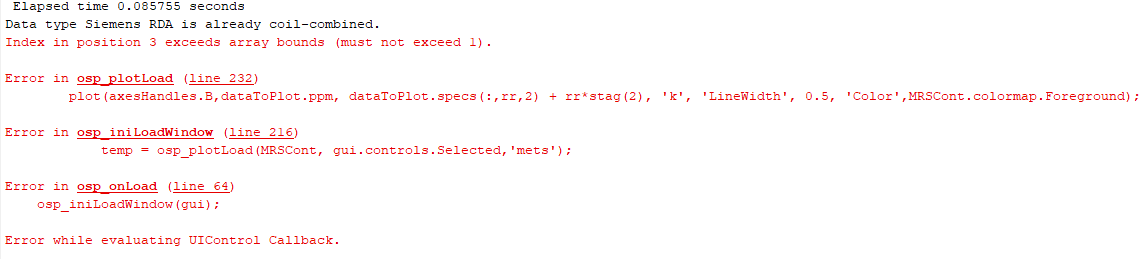
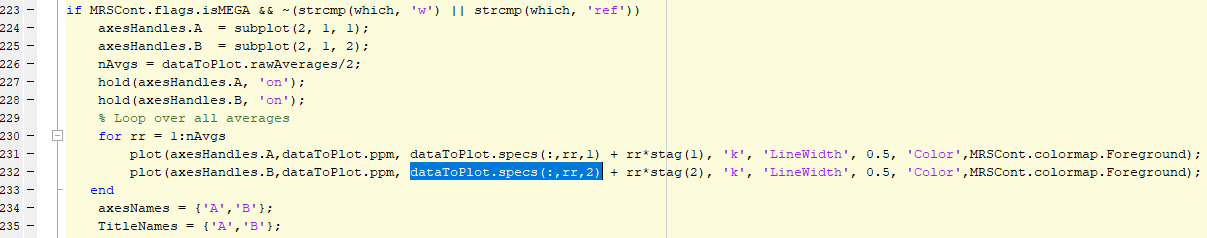
Still the first one with the plot is still there. Running the matlab code line by line I found out, that my spec data only has dimension 281 x 2 (with complex numbers) instead of three dimensions: extracted out of “osp_plotLoad.m”
Thus, it can not access the specs(:,rr,2). Further, the number of averages calculated out of the data is 32. But the loop is not able to run beyond 2 because of the problem with the dimensions. Is there something wrong with my data?
Further, the variable “stag” seems to be 0 in my case and also only has one dimension. Thus, stag(2) would also not work. Did I do something wrong here?
Thank you for this software. I am having similar issues as Tina had and I am just wondering if the solution given to Tina can be posted here. Thank you.
Hello Helge,
Thank you for the response.
Please find the job file and a test data will be sent to you via message since I could not upload .m and .rda files here. Thank
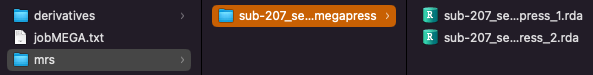
If you are using rda files from a MEGA-PRESS acquisition you have to have both the averaged edit-ON and edit-OFF spectra in a single folder like this:
Afterward, you add the path to this folder in your jobfile to the files cell array (see attached jobfile.txt file). jobMEGA.txt (1.1 KB)
Another comment about your data, if you are still in the acquisition phase of the study, I would highly recommend exporting TWIX raw files, non-averaged and non-combined DICOM files, or at least non-averaged rda files instead of averaged rda. This allows you to perform more elaborate postprocessing which usually improves data quality.
Thank you for the time spent on this work. I will run it again based on your suggestions and get back to you.
Unfortunately, all the data for this study have been collected but we will factor your inputs in our next project.