Hi there,
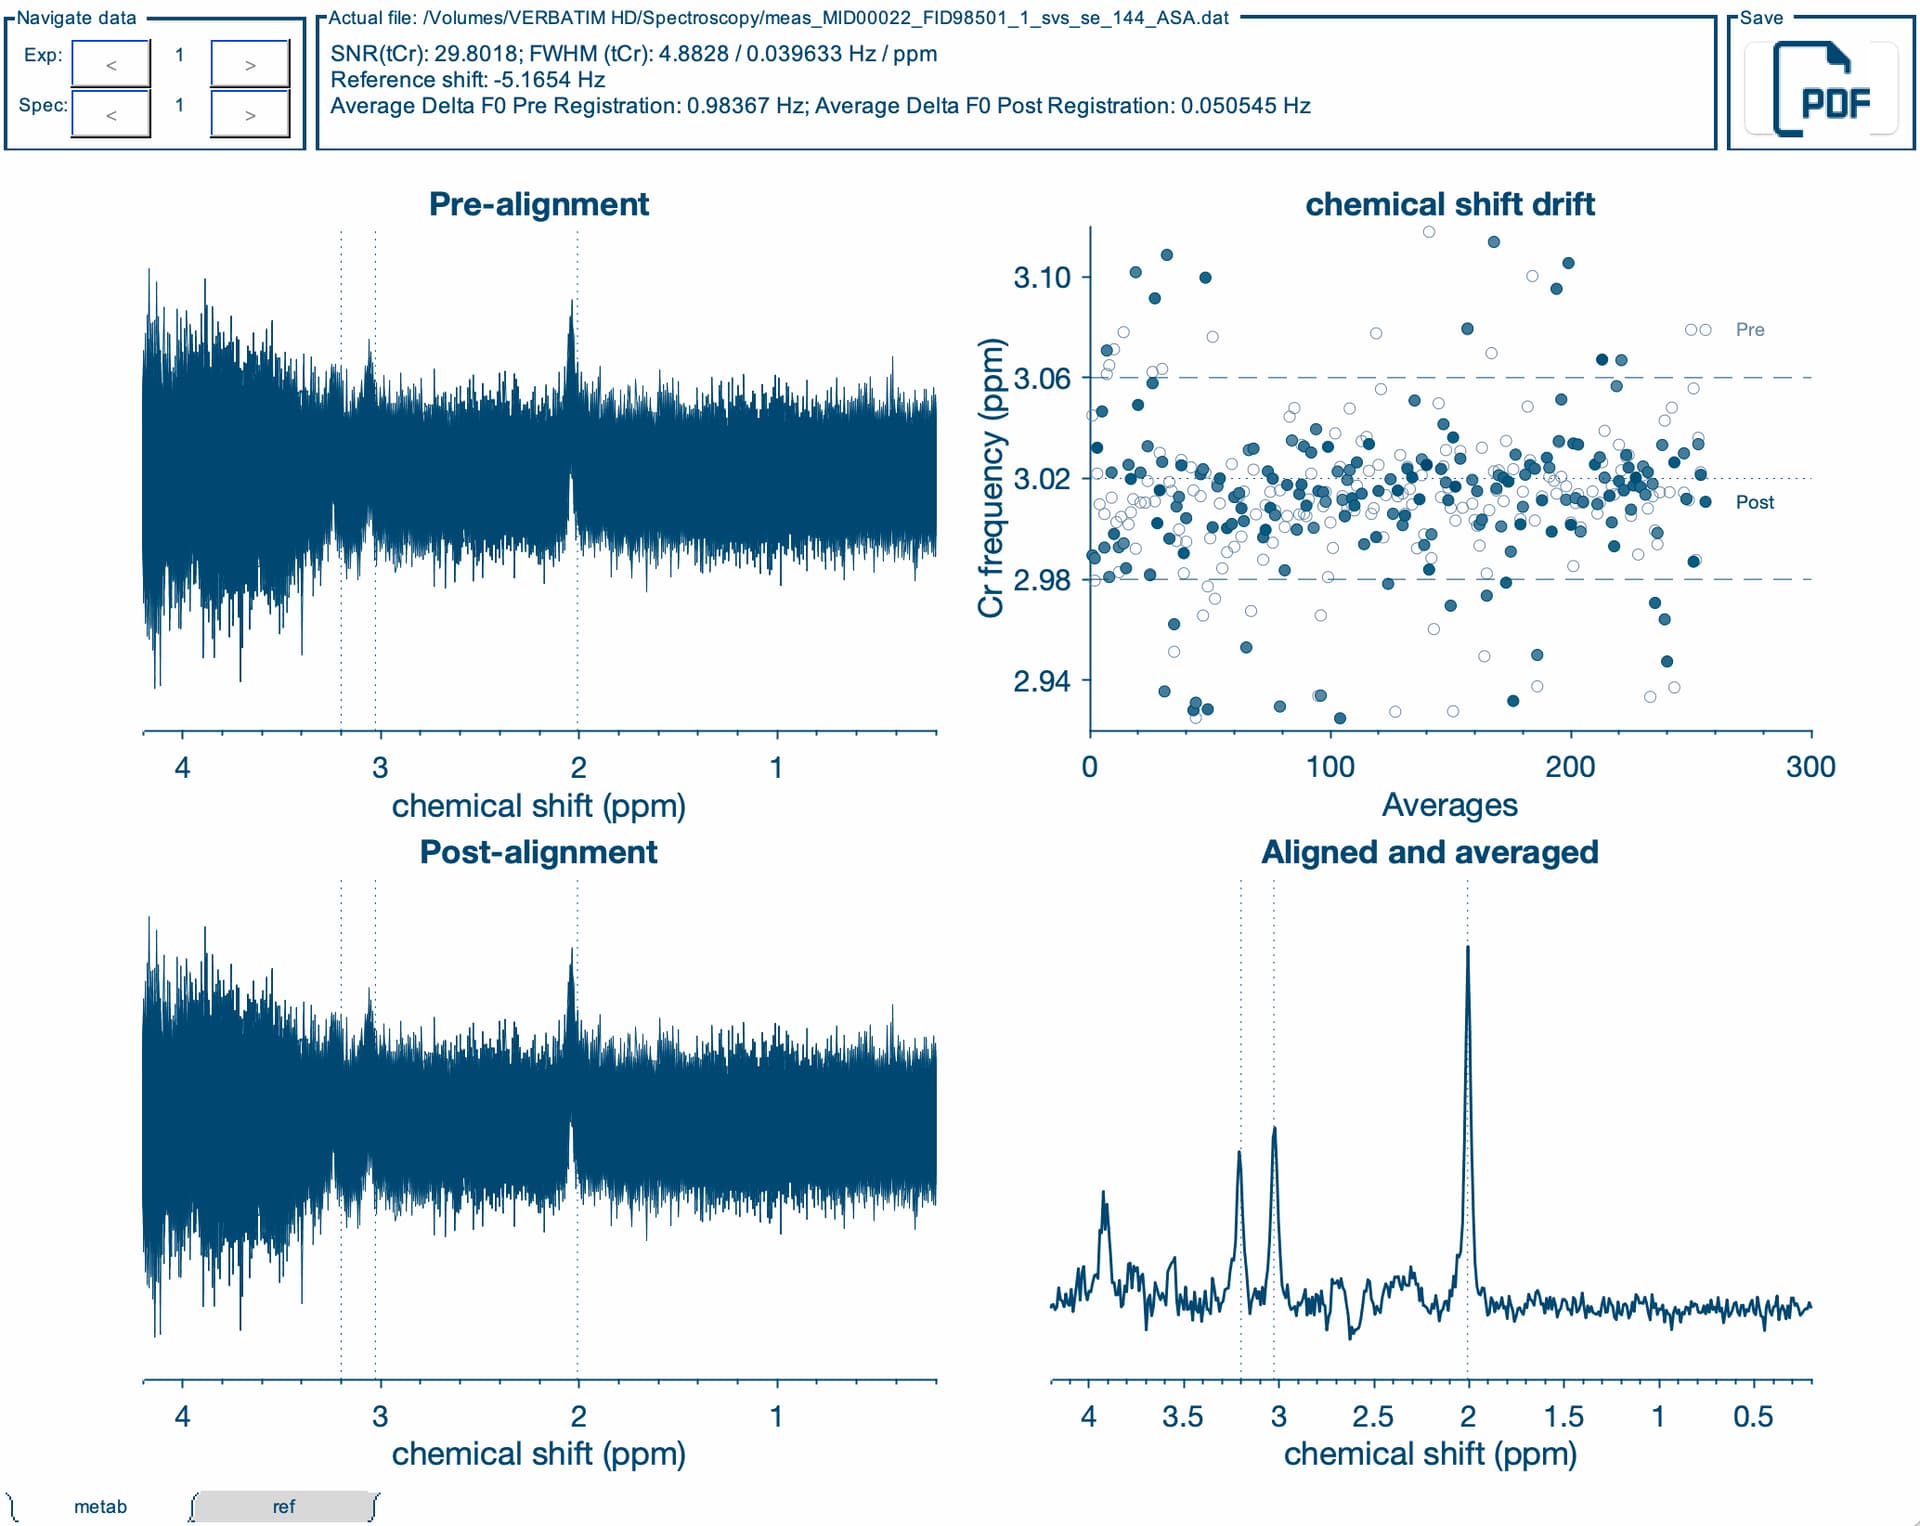
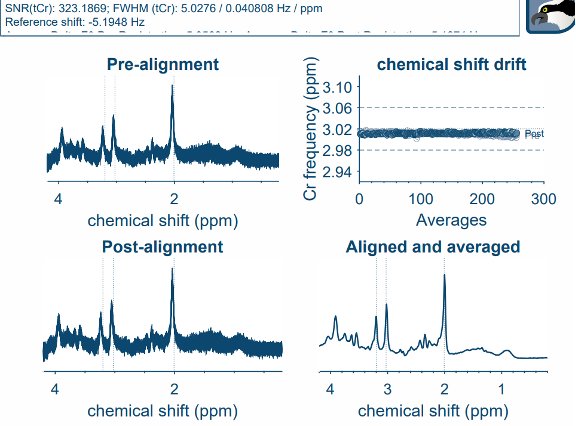
I have been trying to analyse some SVS data in sheep using Osprey 2.5.0 with MATLAB R2022b (TE=135ms and 144ms, unedited PRESS at 3T from a single scanner, using twix data), and consistently found the Cr frequency drift plot is very scattered in all scans with no line of best fit possible (see image). I have tried using the GUI as well as script. At first I thought it may be a scanner issue, so I ran a whole bunch of test scans with the spectroscopy phantom and in healthy sheep, which all replicated the issue. Then I explored the possibility it could be low creatine in the spectroscopy phantom and sheep, so ran the same sequences in human brains but found the same issue in all scans, aside from one PRESS SVS 30mm voxel in a human brain which I also ran at TE=30ms with 256 averages, and the plot was much improved.
The FWHM on the scanner and spectra being generated by the scanner look fine, although we do see an overall reduction in quality for sheep, but I believe this is to be expected, given that there may be more inhomogeneities in sheep brains, given their small size, thick skulls, pathology in the research animals, etc.
Is there something at the processing or analysis level that we can do to improve this data, or is there something I may be doing wrong? I’ve tried a whole bunch of things on the scanner to potentially reduce drift and improve quality (i. e. performing MRS first thing in the morning before any EPI, manual shims, frequency drift correction, increasing averages, etc.) without managing to improve the drift plot. However, I have seen similarly poor looking drift plots in some of the datasets from NITRC Multi-site Frequency Drift MR Spectroscopy dataset, so it would be interesting to hear what the tolerance is for frequency drift in the data [DATA SUBMISSION] Multi-site 3T MRS Drift Data
Very happy to provide raw data if this might help.
Many thanks,
Georgia