Hi all,
We are frequently observing a potential issue in XA60 with HERMES and PRESS. Specifically, we notice a rising slope after the water peak. Should we be concerned about this, and is there a recommended way to address it?
Best,
Andreia
Hi all,
We are frequently observing a potential issue in XA60 with HERMES and PRESS. Specifically, we notice a rising slope after the water peak. Should we be concerned about this, and is there a recommended way to address it?
Best,
Andreia
Are you able to export the data and display a larger ppm range in another tool? What does that broad peak look like in each individual transient/average?
Dear William,
Thank you for your reply.
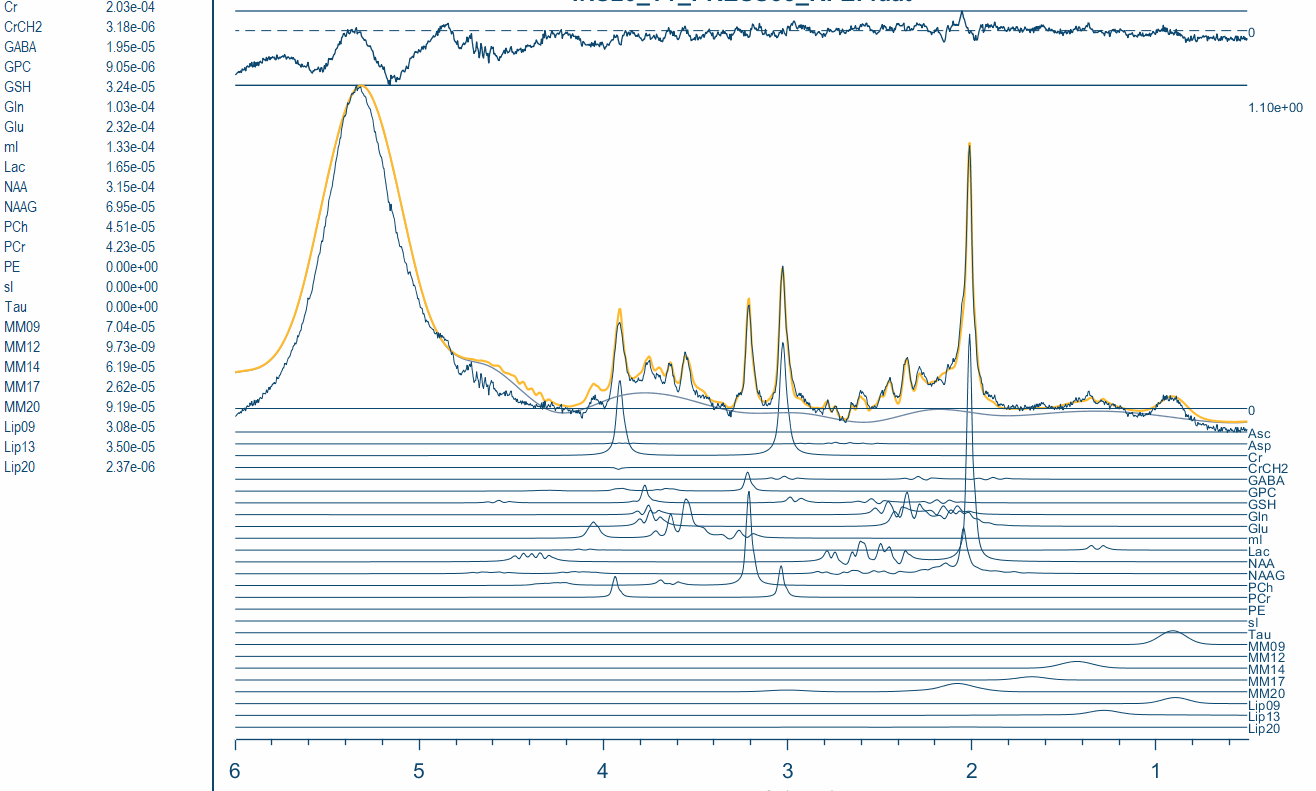
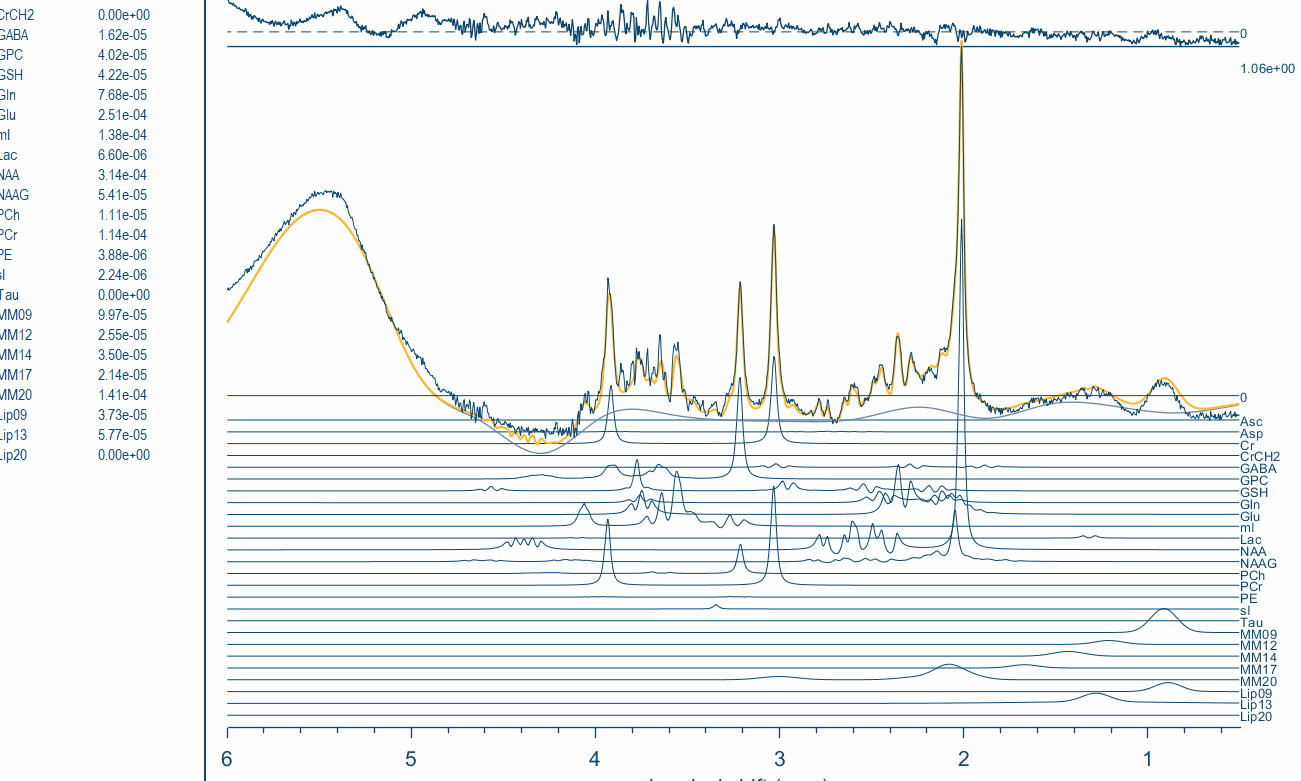
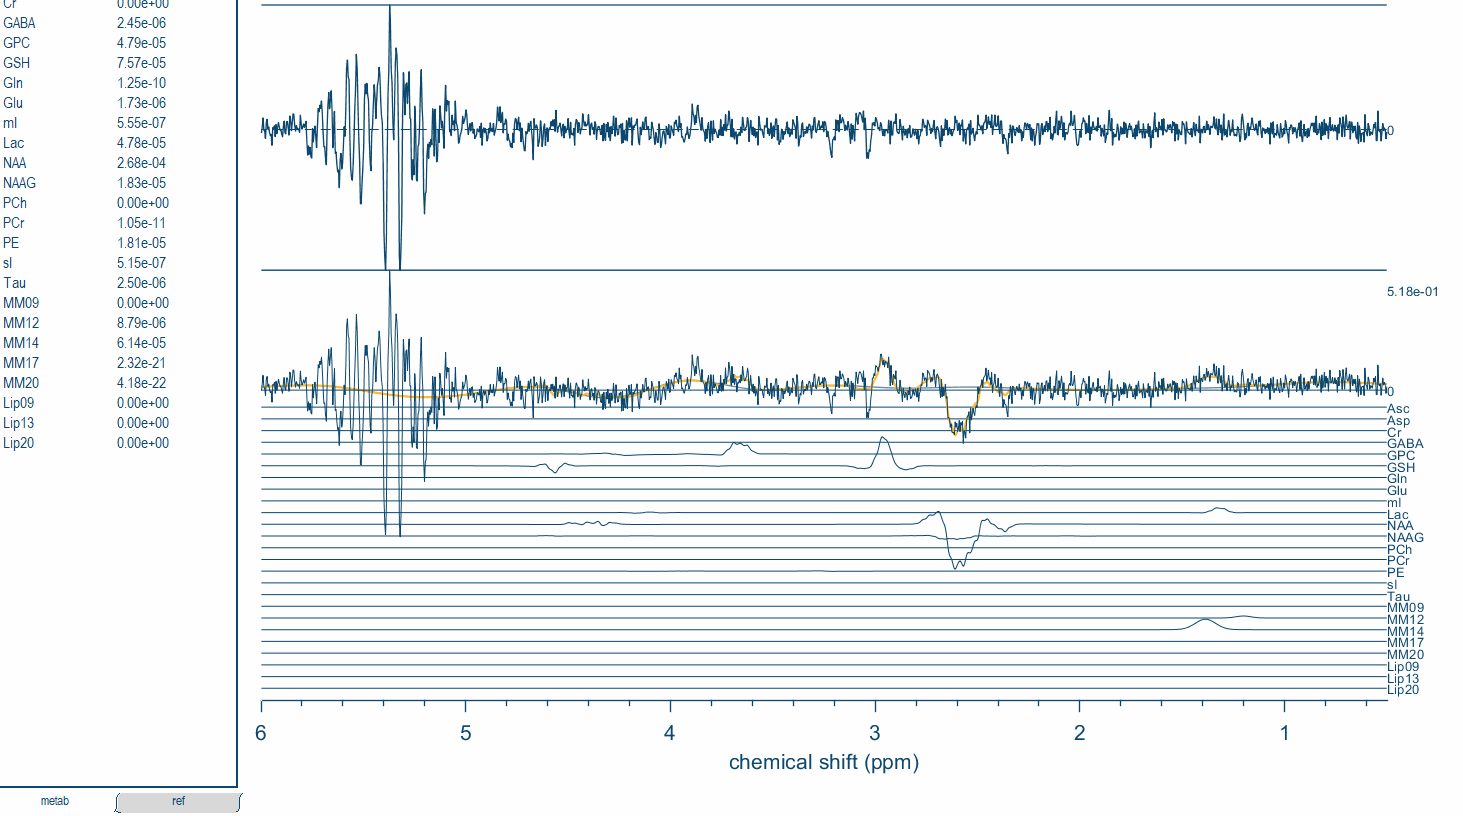
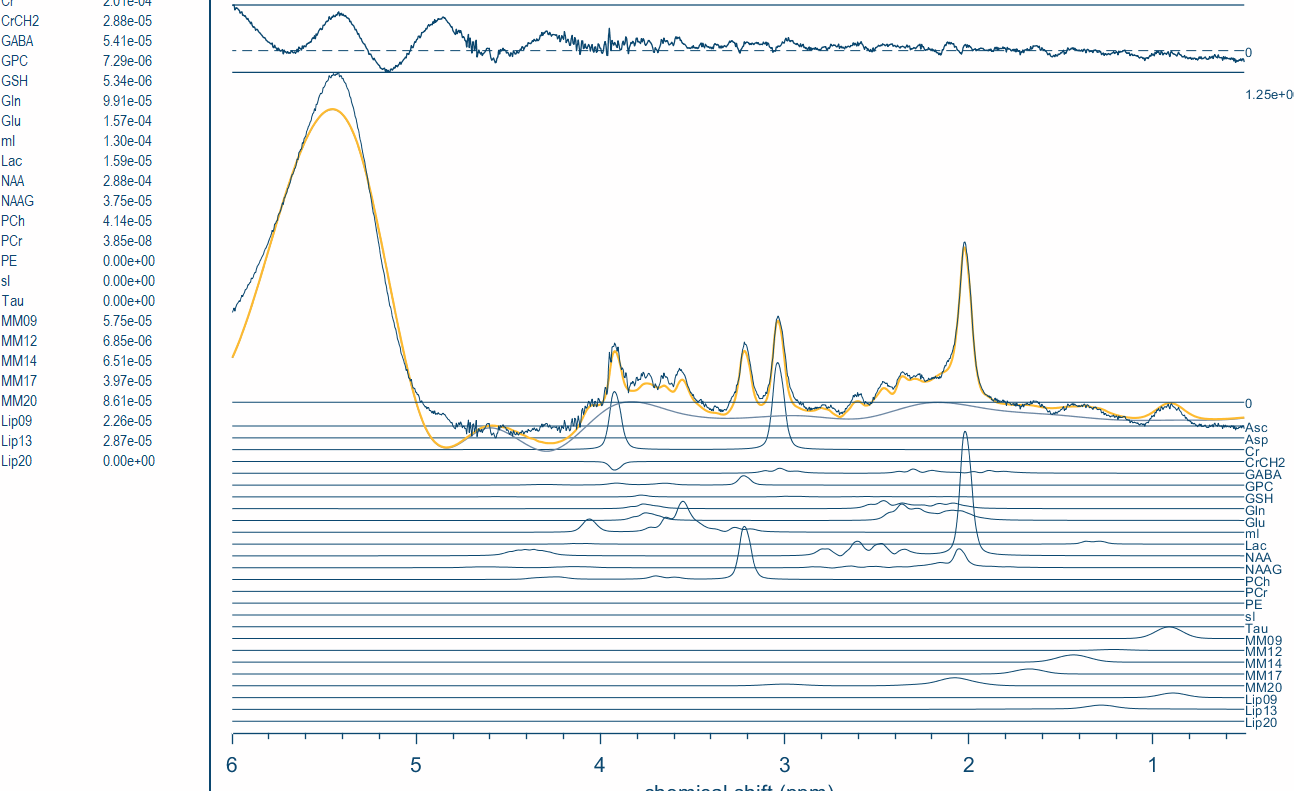
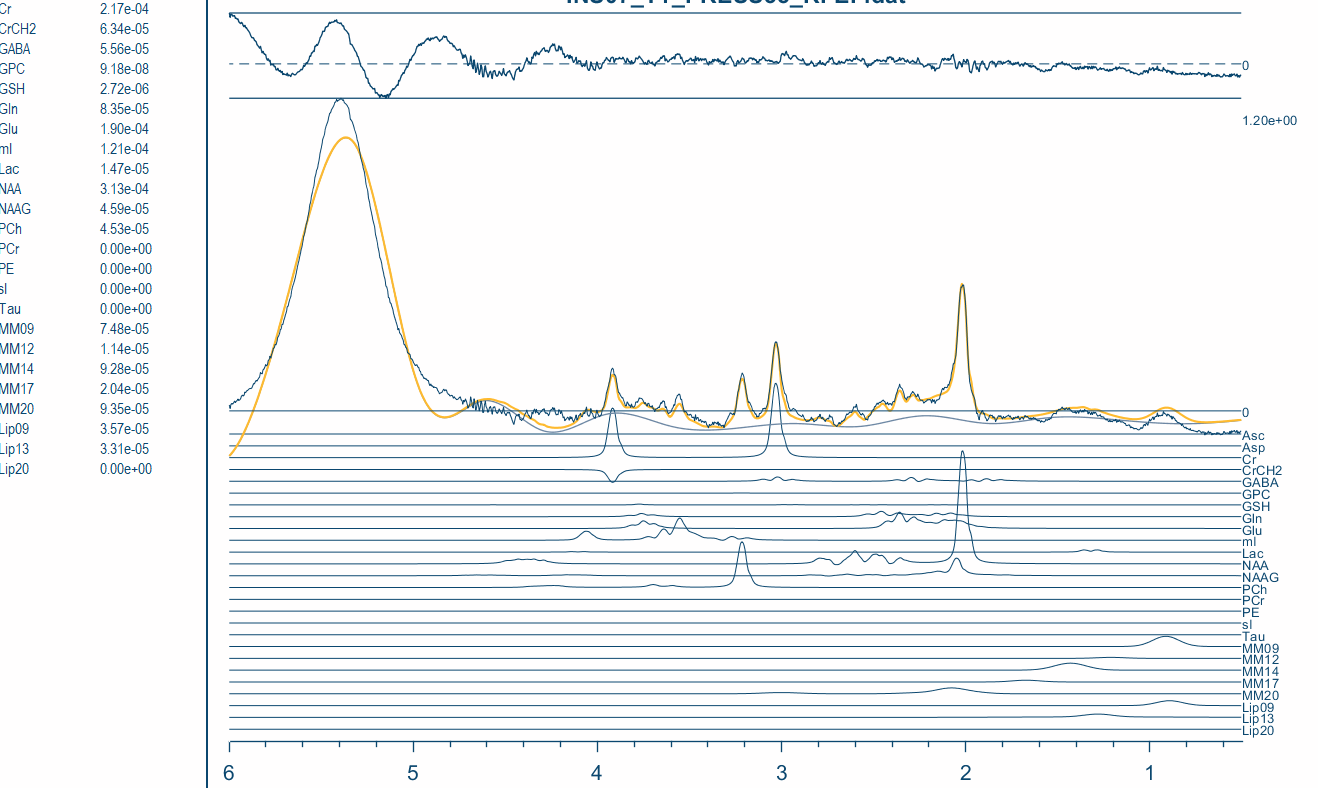
I changed Osprey’s jobfile ppm range, but the range was only expanded in the fitting plot - here is the outcome from 2 PRESS datasets:
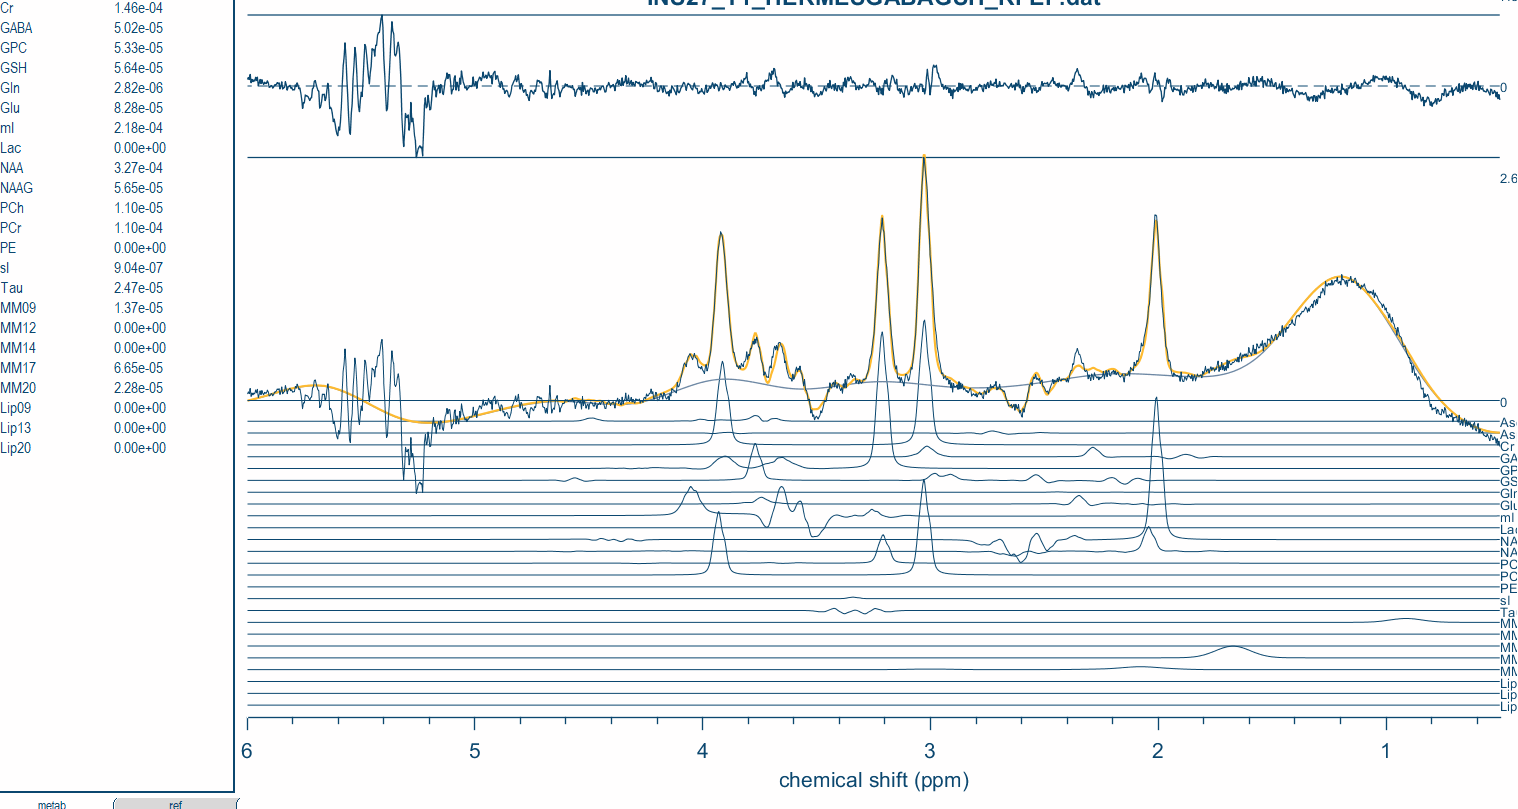
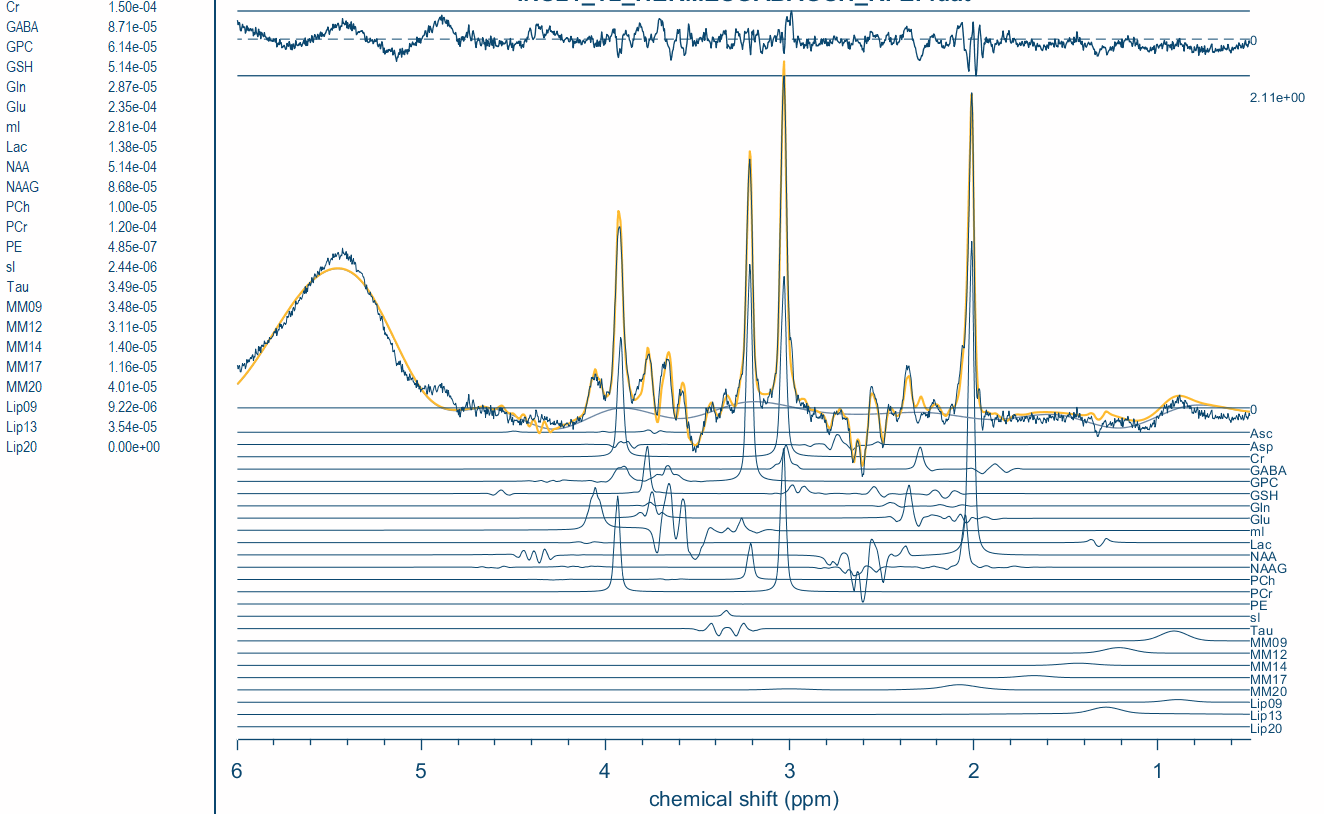
Regarding the HERMES datasets, we now know that the sequence implementation used was not ok and we have since updated it. So far, we’ve acquired one dataset that didn’t show the slope in the console and looks like this in Osprey:
I’m still uploading these figures because there’s an artifact in a similar range to what we see in the PRESS output. However, I assume this is not a problem as its effect seems further away from the metabolite signals. Do you confirm?
I’m not sure how to check each individual transient. Could you please let me know how to do that if it’s still relevant?
Thank you very much,
Andreia
This is super-fascinating. I’ve briefly been thinking lipids because of the enormous width and irregularity of the lineshape (and double-bond protons in unsaturated fatty acids are at around 5.3 ppm) but we’d have to see some regular lipid signal as well. Astonishing really. What brain region is this?
Yes, @AndreiaPereira , what’s the brain region? This reminds me of one other study I’ve seen where a voxel was in a tricky position up against brain boundaries. What we found in that study, was the majority of the voxel was fine to shim, resulting in good metabolite linewidths, but a small fraction of the voxel (or just outside it) was very poorly shimmed. The water in this region wasn’t suppressed and appeared somewhat like this, with the water suppression “hole burning”.
Hi both,
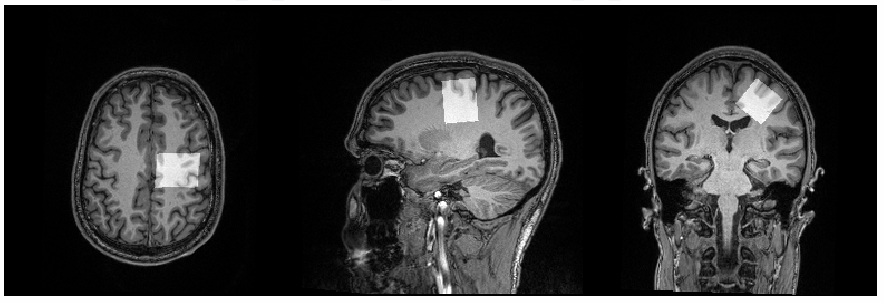
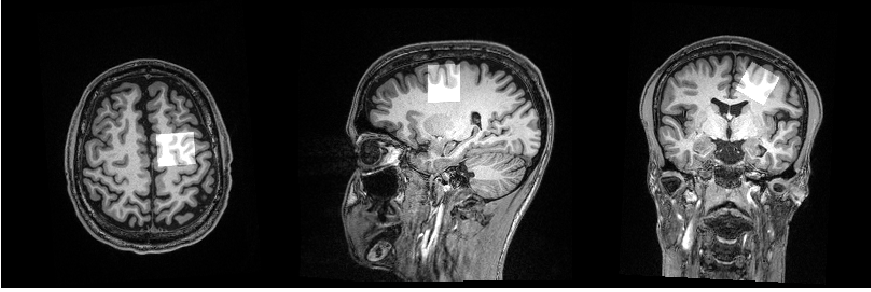
This is a right frontal eye field voxel:
Our protocol includes PRESS and HERMES scans, we see this repeatedly in the PRESS datasets, not in the HERMES. We only saw this in HERMES in our previous version but it wasn’t there now that we’ve updated the sequence (will be getting a second dataset today).
What was the change made to the HERMES sequence? Could it also affect the PRESS?
From my point of view, the PRESS artefact doesn’t seem to be massively affecting the spectrum, beside a baseline distortion that is well absorbed by the spline baseline. Is the artefact always at the same shift position?
One last question, are you using any sat bands? Any other settings in the exam card we can take a look at?
TLDR: I’d try to pay more attention to avoiding the lipid signals between 1 and 2 ppm).
Thank you for your feedback, that’s reassuring.
We had the HERMES binaries updated to a different version as the previous one was resulting in unexpected spectra output. I don’t think this has had any impact on the PRESS sequence. We have been seeing this in the PRESS sequence for some time now, but I’ve only checked the extended ppm range for the 2 datasets in this discussion - I will check the other to see whether it always appears at the same location.
Thank you for your feedback, also very reassuring.
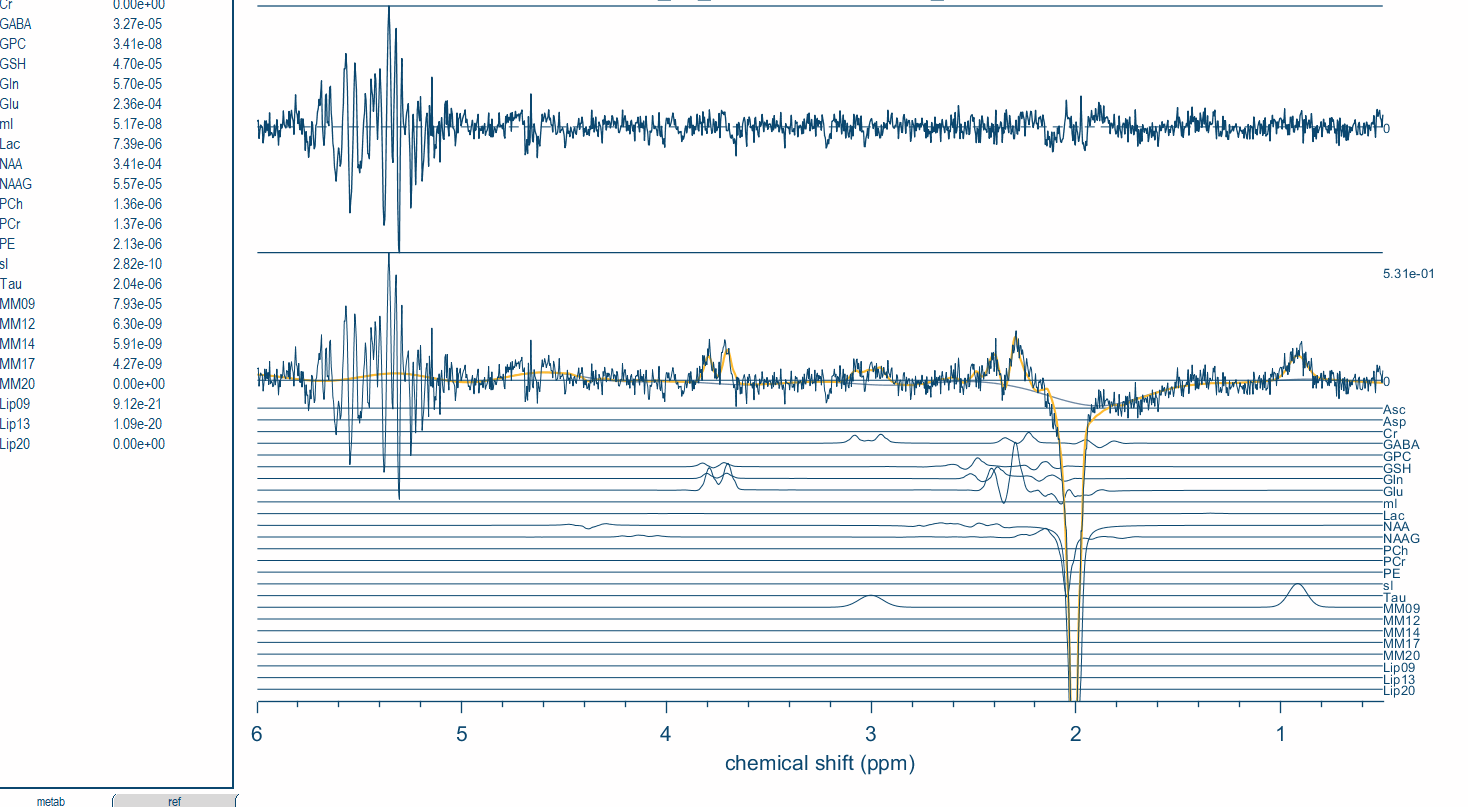
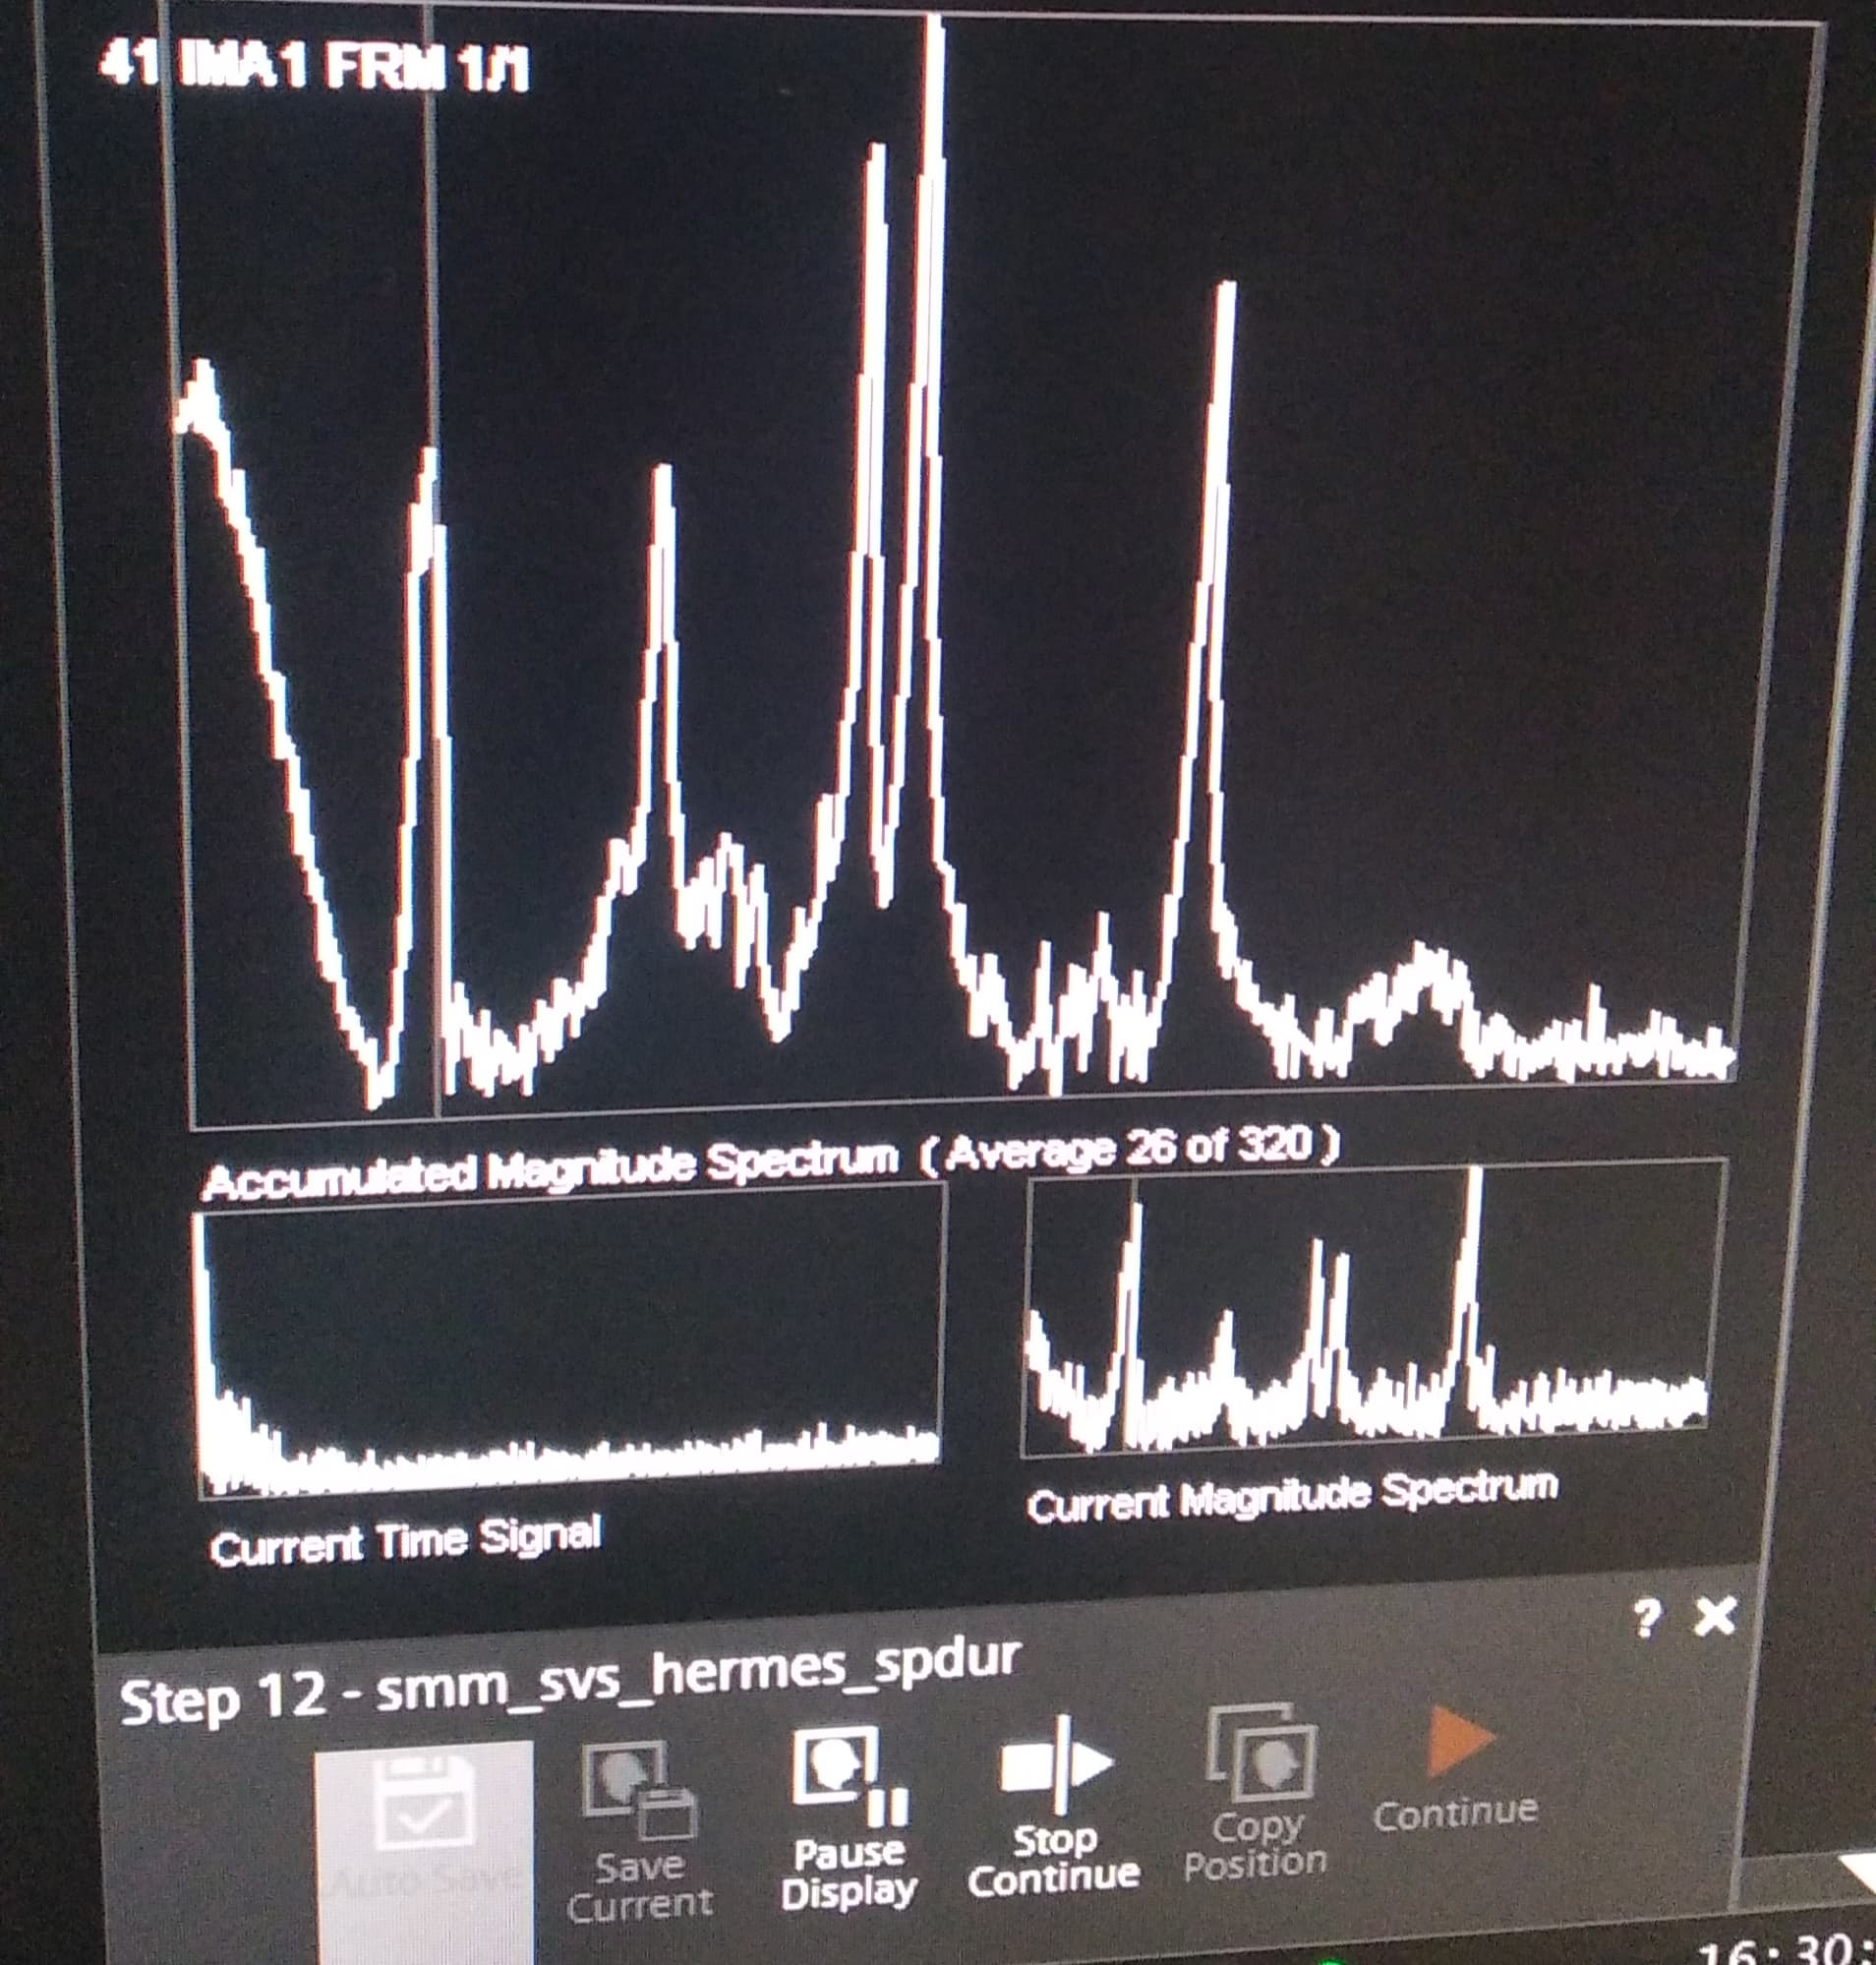
However, we are also seeing it in yesterday’s HERMES dataset:
We are not using sat bands - the exam card from yesterday’s session is attached (HERMES parameters from page 6 onwards) - thanks for checking!
MRS_XA60_17feb25.pdf (783.4 KB)
I think the lipid signals around 1 ppm look typical, not excessive, but the other huge hump is there. Still, it does not seem to affect the metabolite signals. Would you say that we can still use the datasets where we see this artefact?
Yeah, I’d say you can use them. If you just used the typical fit range you’d not even be able to see them - I wonder how many people have these artefact without ever knowing!
edit: also yes, none of the HERMES binaries change anything in the product PRESS sequence
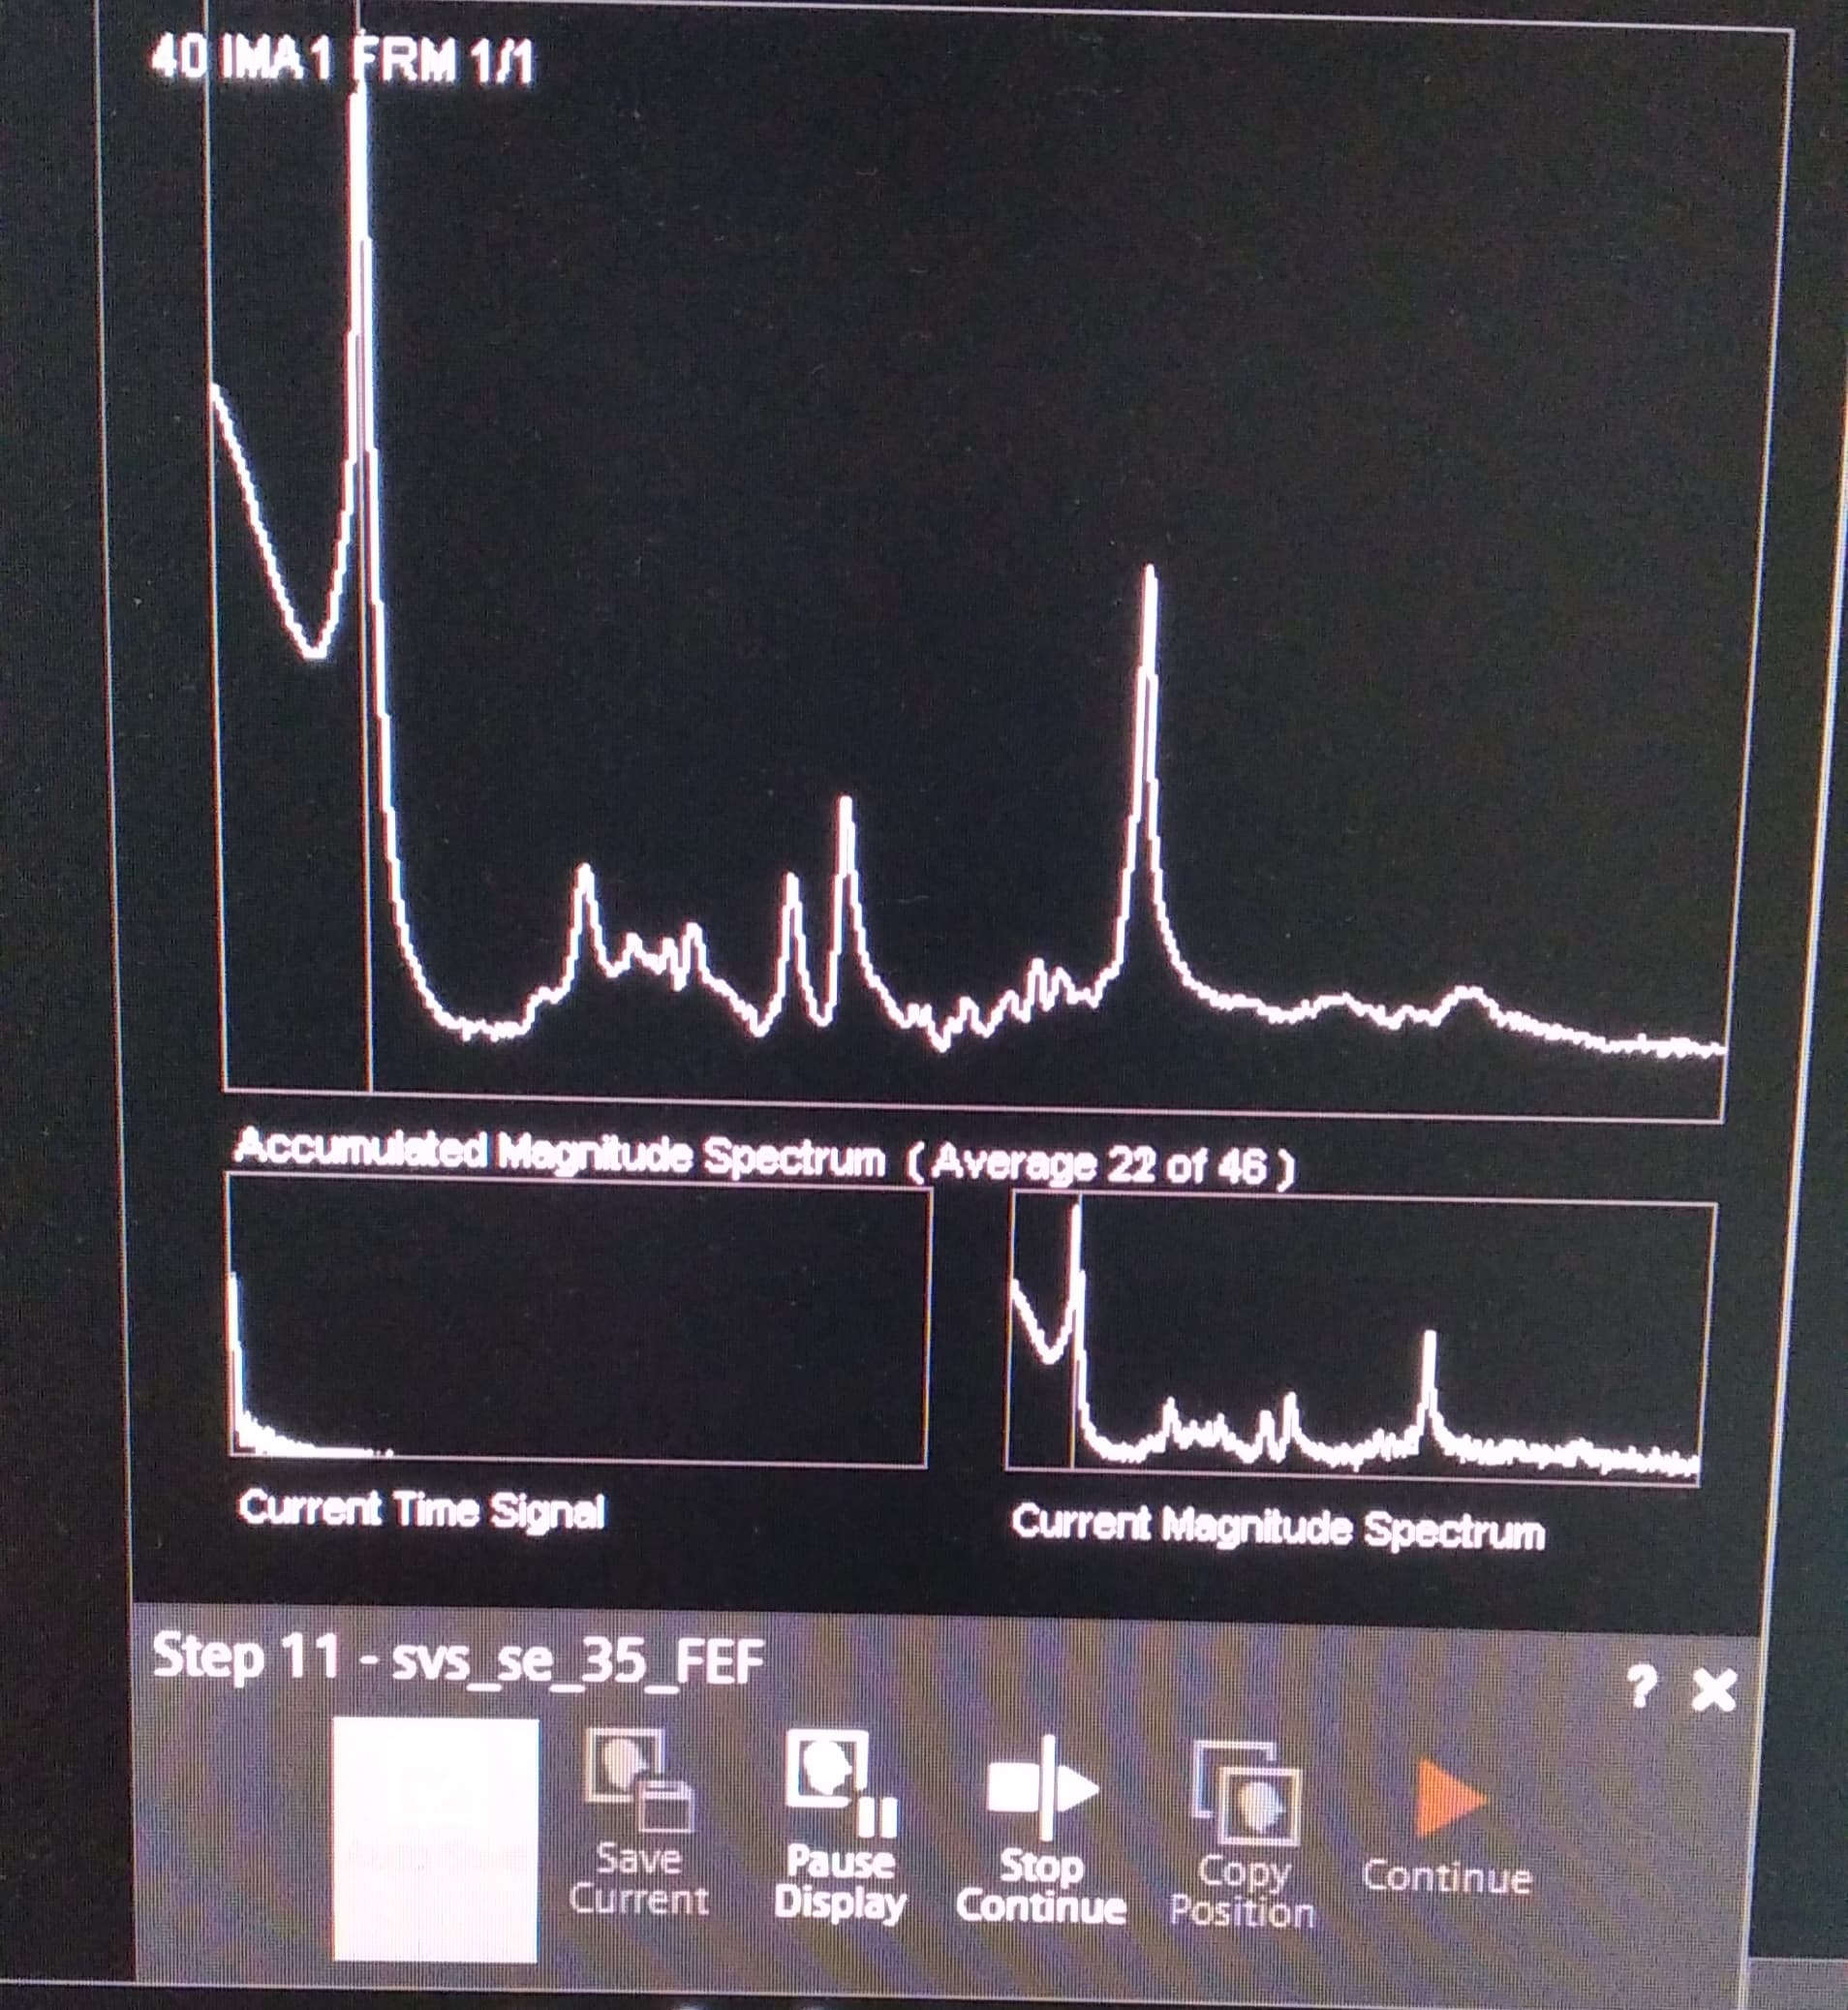
What caught our attention was indeed this aspect in the console, that we are now seeing in some HERMES scans too:
I’ve now checked previous PRESS (and HEMRES) datasets and while I wouldn’t have seen this using the typical fit range, it seems to have implications in the next two PRESS datasets:
The metabolite part doesn’t have the typical aspect, but maybe it’s only a matter of scale(?). Should these datasets be excluded?
@wclarke the artefact always appears at the same shift position between 5 and 6 ppm.
I just took a look at your PDF. The next time you see this signal in PRESS, you could try playing around with some of the following settings (one by one, not all at once)?
I also noticed another thing that you should fix when you start a new protocol/study, not in the middle of ongoing acquisition:
Hi Georg,
Thank you very much for your feedback! Very helpful.
Regarding the PRESS datasets in my previous post, would you recommend excluding them?
The model over the fit range still looks pretty much like the data IMO. I don’t think I’d exclude.