Hello, I am working with the following SVS data and am having trouble finding an appropriate basis set.
Example Metab data:
Data shape (1, 1, 1, 2080, 32, 128)
Dimension tags: [‘DIM_COIL’, ‘DIM_DYN’, None]
Spectrometer Frequency: 123.235471 MHz
Dwelltime (Spectral bandwidth): 4.167E-04 s (2400 Hz)
Nucleus: 1H
Field Strength: 2.89 T
I am new to working with MRS data and am unfamiliar with the parameters/methods to simulate a basis set.
I tried using MRSCloud to simulate for 3T Simens TE 30ms, however the final basis set came without Glucose - which is the key metabolite I need to analyze.
I tried using a downloaded press3T_30ms LCModel basis set but got this error: “fsl_mrs.utils.results.FitRes.QuantificationError: Metabolite reference Cr has not been fit (conc=0). Please choose another or refine fit first.” I’m not sure how to troubleshoot this.
I looked into the fsl_mrs basis simulation tool but am unsure on how to create the sequence info json.
I tried using the basis set available in Juchem’s repo, but the length of the BASIS set is lesser than my FID length (2080)
Finally, I tried editing and running the FID-A script run_simExampleBasisSet.m using my sequence parameters to generate the .RAW files for the metabolites of interest. Now I’m trying to figure out how to use LCModel’s makebasis function to create the .basis file, but I’m a bit confused about how to edit the makebasis.in file with the control parameters?
If you have any suggestions on how to troubleshoot/go about simulating an appropriate BASIS (that includes Glucose), I would greatly appreciate your help!
I/We can probably help you through this. I think there are a number of reasonable options here which we can adapt.
If you can provide an example bit of data and basis I can see what is going on with #2. Alternatively with #4 we can pad the basis sets (or truncate your data). Finally, @admin do you know if MRSCloud can have custom spin system definitions?
The code of MRSCloud is open access (GitHub - shui5/MRSCloud: MRS Simulation). I see that in the spinSystems.mat file Glucose ‘Glc’ is included. So you can try to simulate the basis sets on your own. Therefore, a good basis is your .json file from your MRSCloud simulation you have already tried. Add manually ‘Glc’ and also take into account that the pulse shapes from Siemens are not freely accessible. So you have to switch from ‘Siemens’ to ‘Universal_Siemens’. This is not perfect, but the basis set of your second point has the same problem that it’s not the exact pulse sequence.
Thank you very much for getting back to this post. I greatly appreciate your help!
Some context about my experiment. As mentioned in my first post, I am dealing with a PRESS sequence, and have glucose as my key metabolite of interest. I’m aware that modeling Glc comes with certain complexities (complex spectral signature and overlapping resonances).
For 2#, unfortunately I am unable to directly share a sample of my data, so I might set aside this method.
For #4, what are the pros/cons of attempting to pad the Juchem basis set? Ideally I would think padding the basis is better than truncating, as cutting out data is something I’d like to avoid (please correct me if my intuition/assumption here is wrong).
For 5# I managed to look across other threads in this forum, and noticed that there are different ways to stitch together the FID-A simulated .RAW files. Would it be possible to suggest on this method if simulating a custom basis works better for my experiment?
Thank you for your suggestion! Could you clarify what you mean by manually adding ‘Glc’? Under the input selection options in MRSCloud I did not previously see an option to select ‘Glc’ as a metabolite, do you mean to say I can add that through an additional step to the produced BASIS?
Hi @S_G,
when you download your results from MRSCloud, there is a configure_out.json file in this folder. You can use this to simulate the basis sets by your own with Matlab and (GitHub - shui5/MRSCloud: MRS Simulation). In that .json file you have to add “Glc” to the metablist and also you have to set “vendor” from “Siemens” to “Universal_Siemens”. Based on this, you can simulate Glc because glucose is created as a spin system, but unfortunately cannot be selected directly via MRSCloud.
Let me check in with the admins of MRICloud (the frontend that MRSCloud runs on) if they can add Glc to the additional metabolites. It’ll be preferable to running it on your own machine (the universal_siemens pulses are not the ones used in the product sequence, but since the product is IP, we cannot put the pulses in the GitHub repo).
Thank you Dr. Oeltzschner, I greatly appreciate your help!
I have a few minor questions:
How does simulation via MRSCloud compare to using FID-A and LCModel to make the basis?
Will I need to run any additional processing on the MRSCloud generated basis prior to fitting my data? (when I ran the simulator the last time, I noticed the no. of data points, bandwidth/dwell time were quite different from the shape of my original data).
MRSCloud is based on FID-A scripts but has been substantially modified to speed up the simulations. It also doesn’t use makebase.in but has a custom function to directly write out the .basis file from the .raw files that FID-A simulations create.
No, you shouldn’t have to. I believe that if you’re using LCModel it can internally re-interpolate the basis set to the desired resolution (not sure about FSL)
I reached out to the MRICloud folks, response pending
Just to clarify, are you sure your dataset does actually have 2080 data points, i.e., can you please share the exam card that was used to generate this data? This feels like the pre-echo zero-padding that a lot of Siemens raw data have, and I suspect you might need to cut the first 32 points to get a well-phased dataset during pre-processing.
unrelated, but I have a theory for the error that FSL threw in your initial post - did you download that basis set from the LCModel website? These are encrypted in such a way that renders them unusable outside of LCModel (but no one should use them anyway as it is unclear what sequence/scanner was used to generate them)
Good point about the 2080 points. If that is the 32 extra points then the substantial first order phase would also explain poor fitting performance in the original #2.
FSL does interpolate, but if the total time covered in the basis is less than the time covered in your FID, then it won’t extrapolate or pad automatically. I think it does now give a vaguely helpful error message.
Thank you very much for following up on this issue and for clarifying my doubts!
For 4# are you sure your dataset does actually have 2080 data points, i.e., can you please share the exam card that was used to generate this data?:
I reached out to the MRI tech coordinating my study and will follow up as soon as they have an answer on this.
For 5# Yes, I had downloaded the 3T basis set from LCModel. I see ok, alrighty.
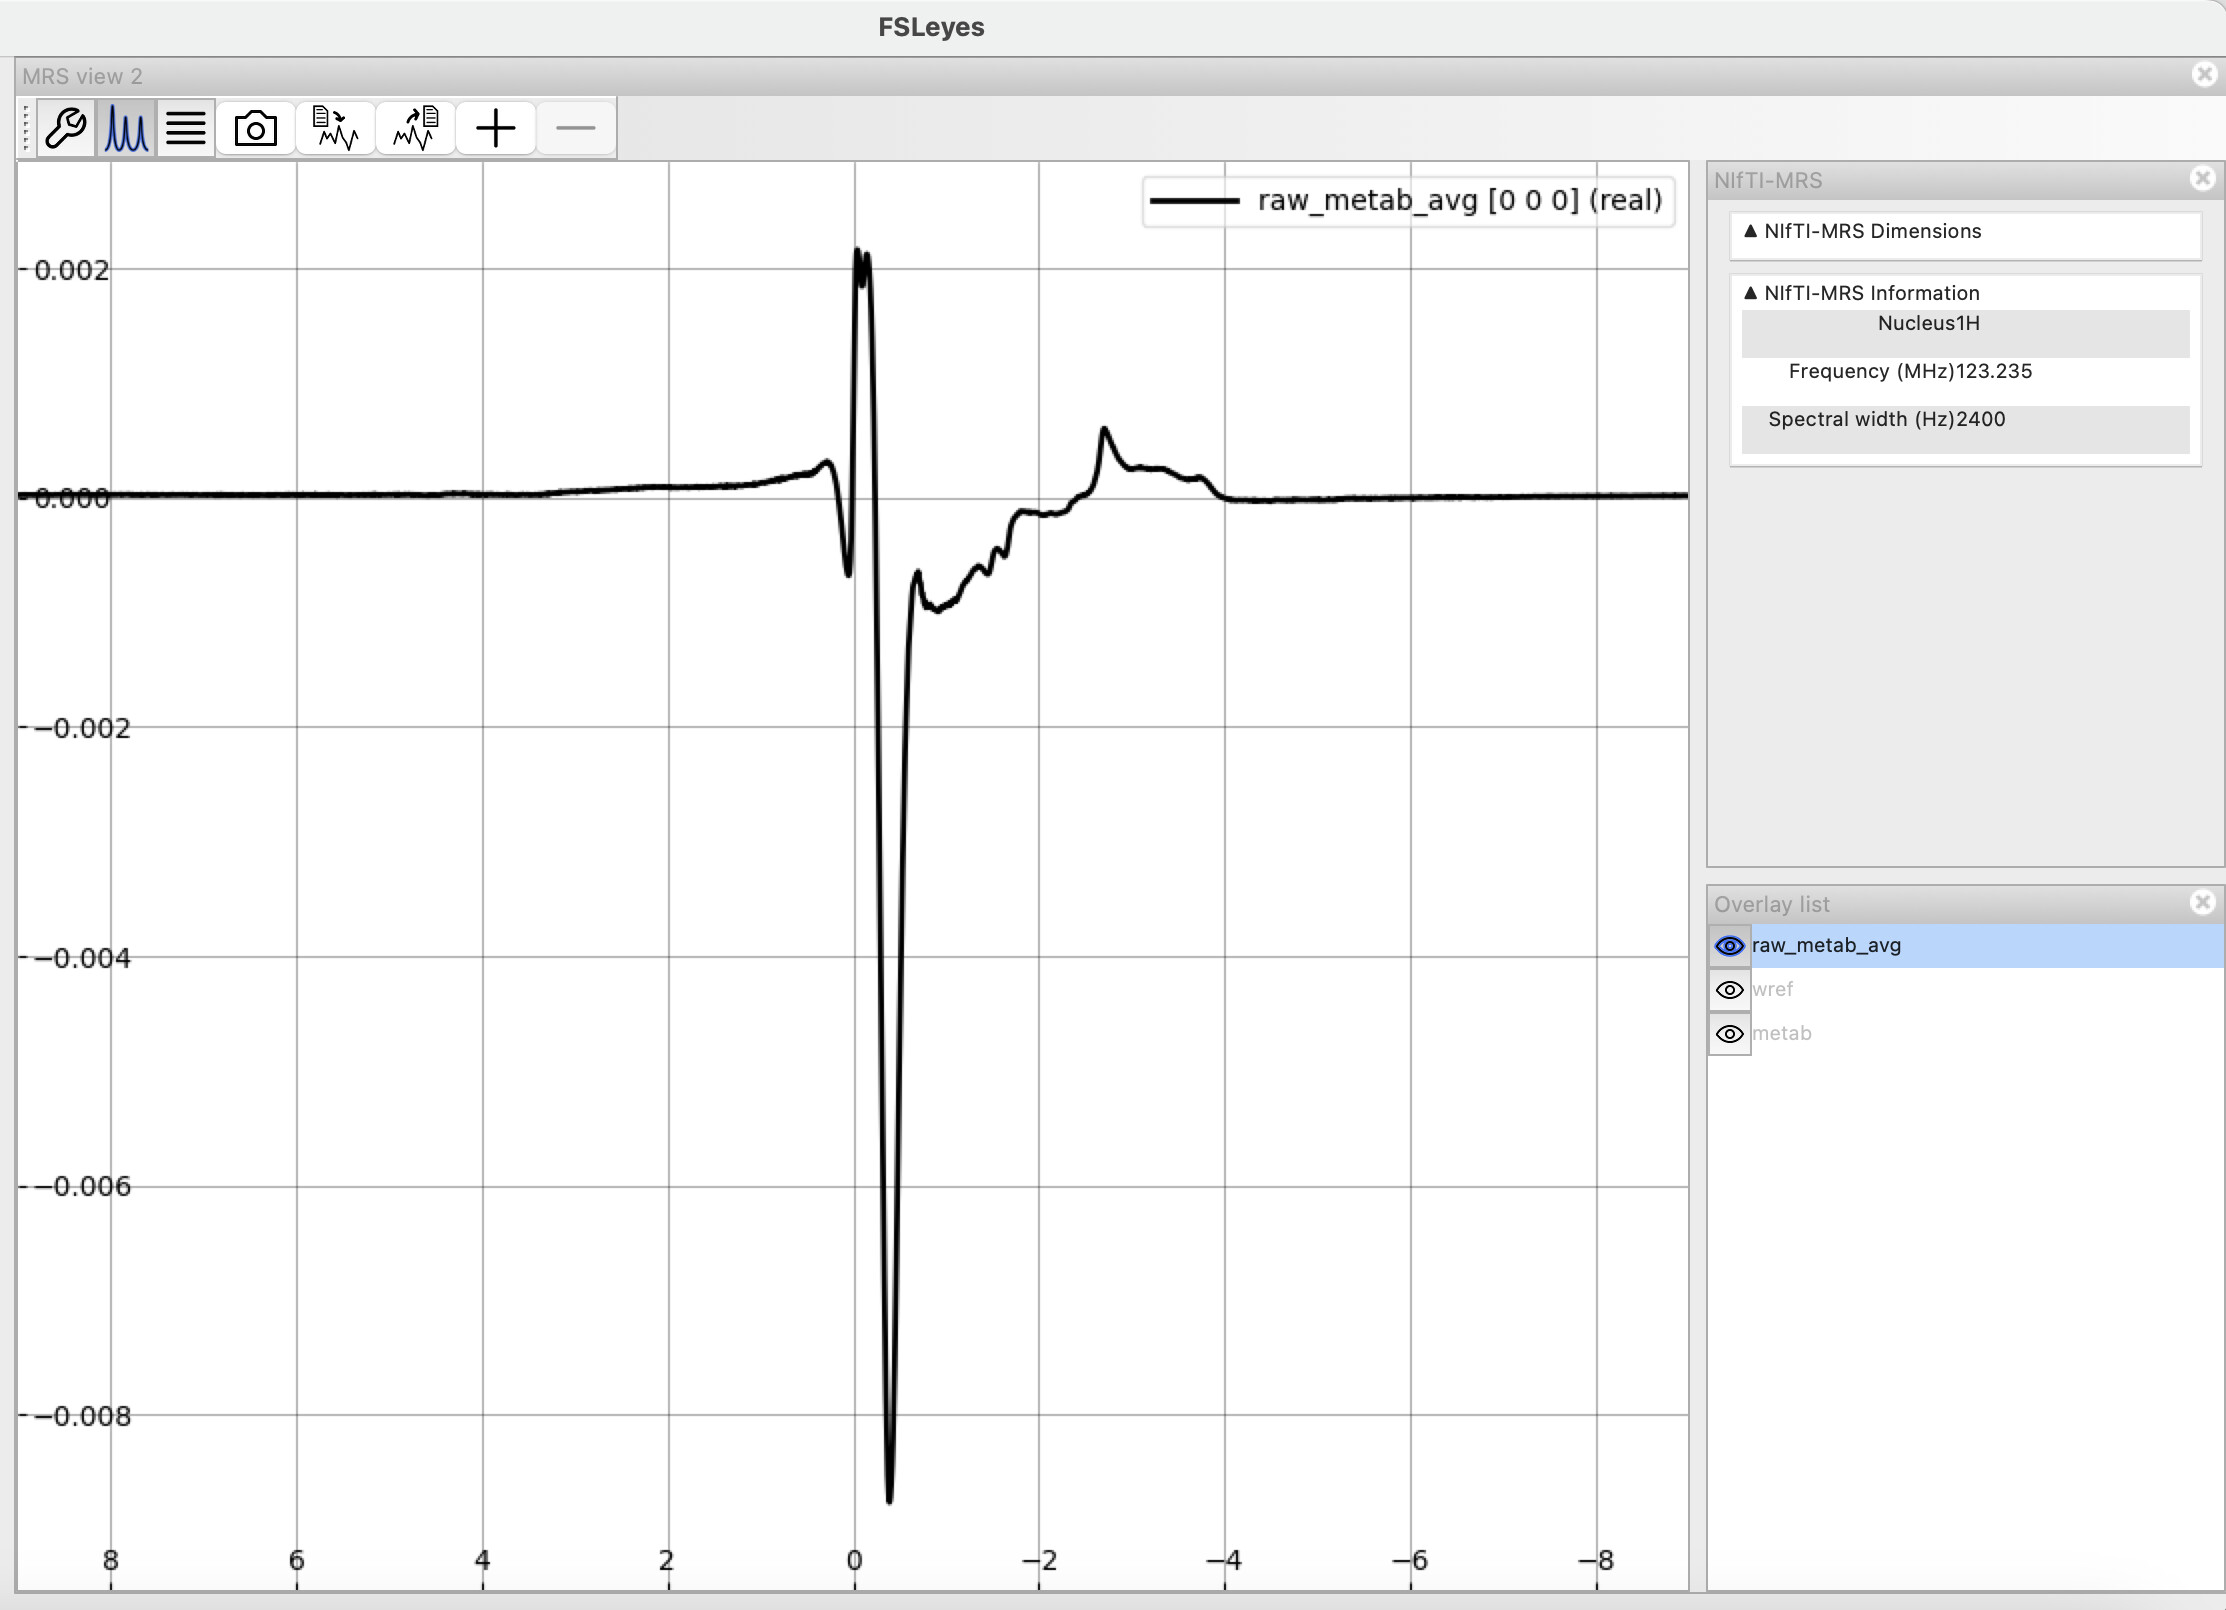
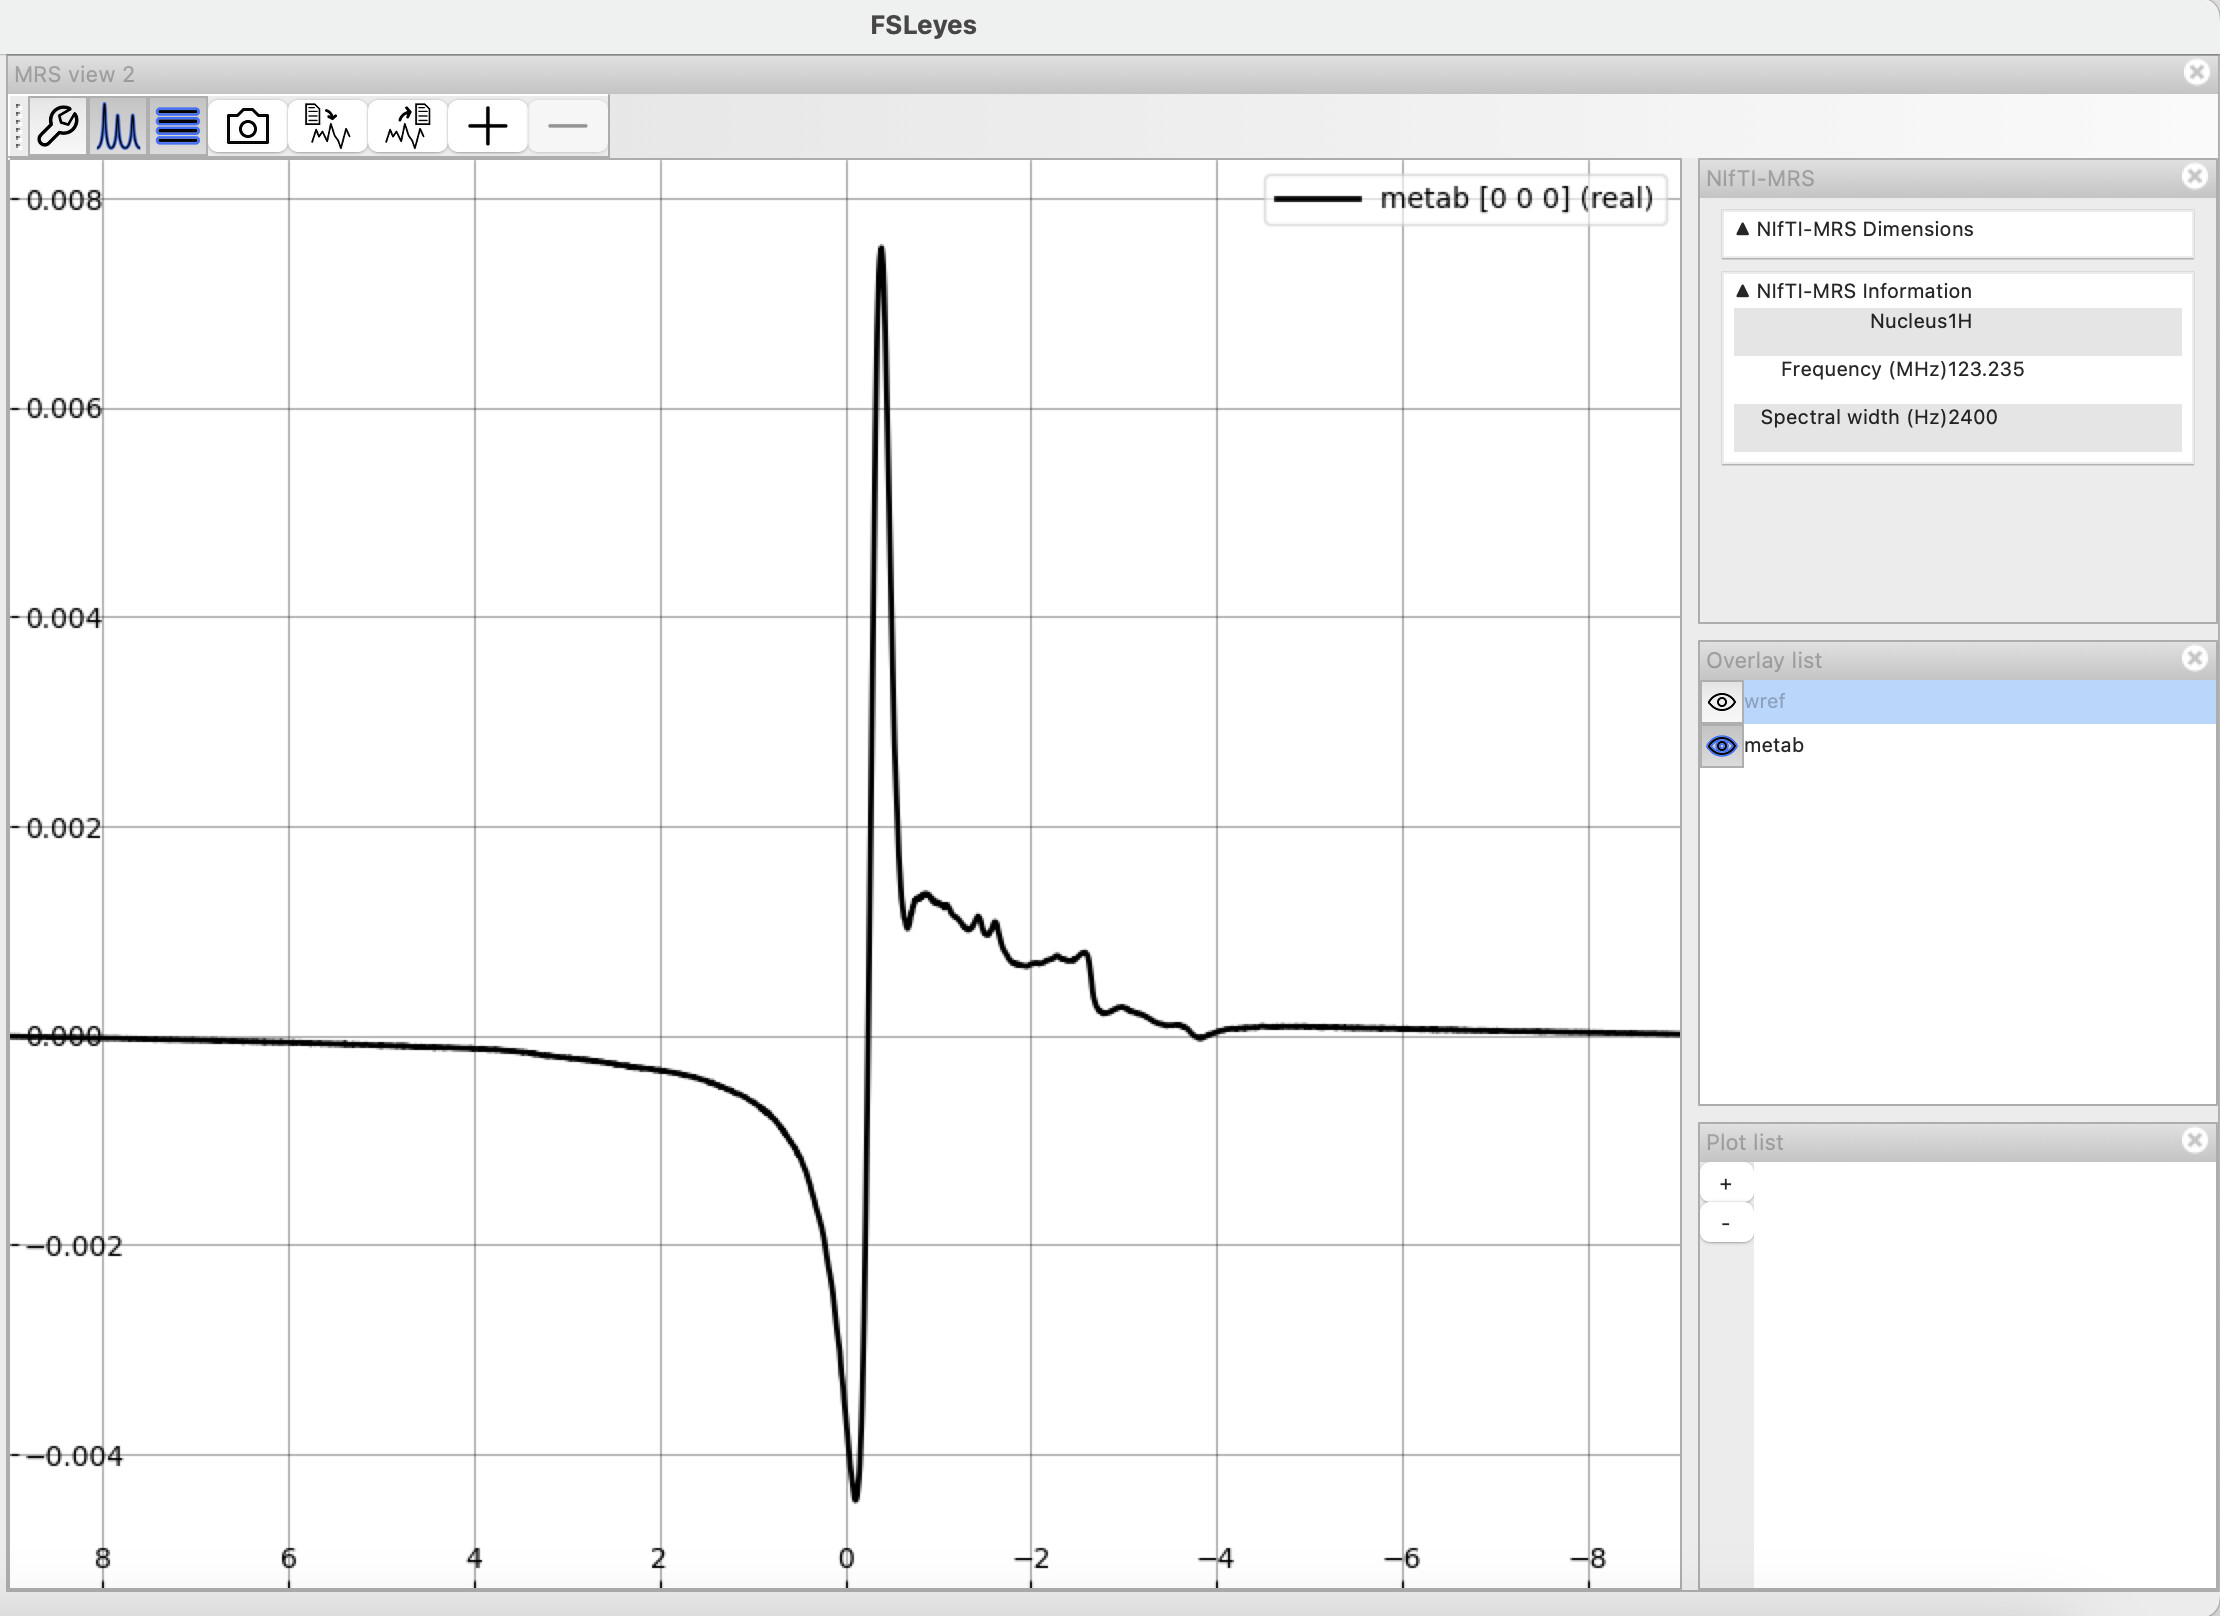
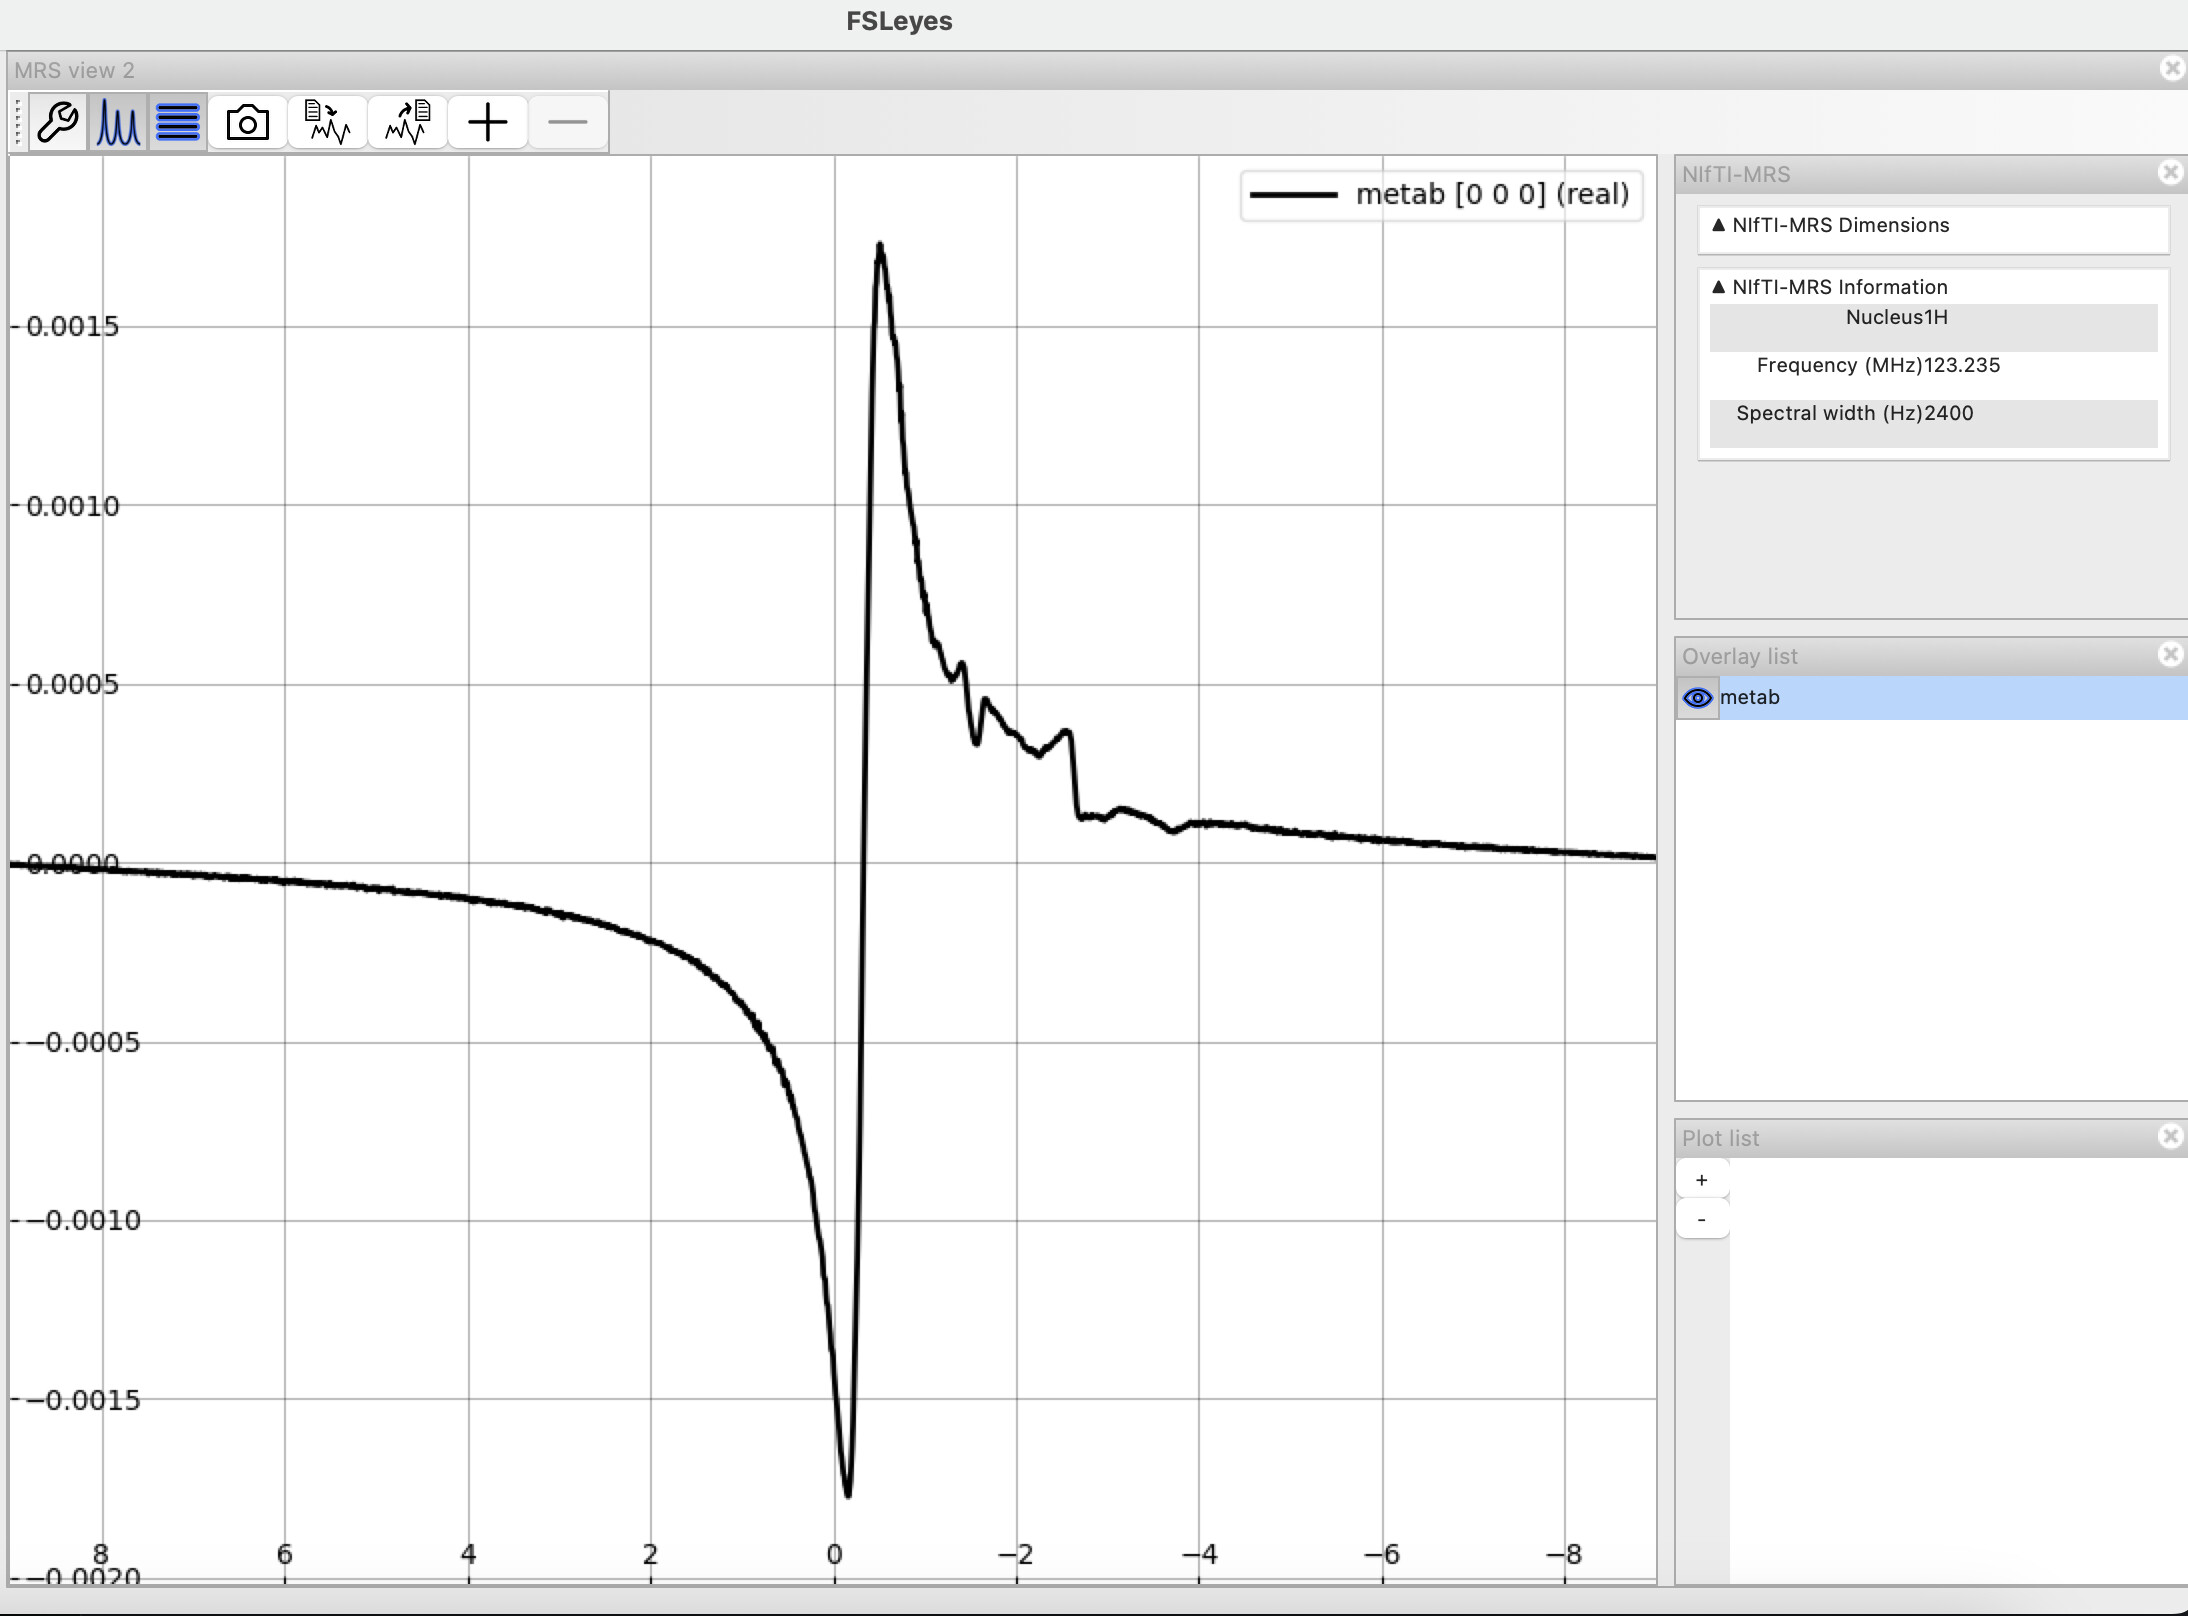
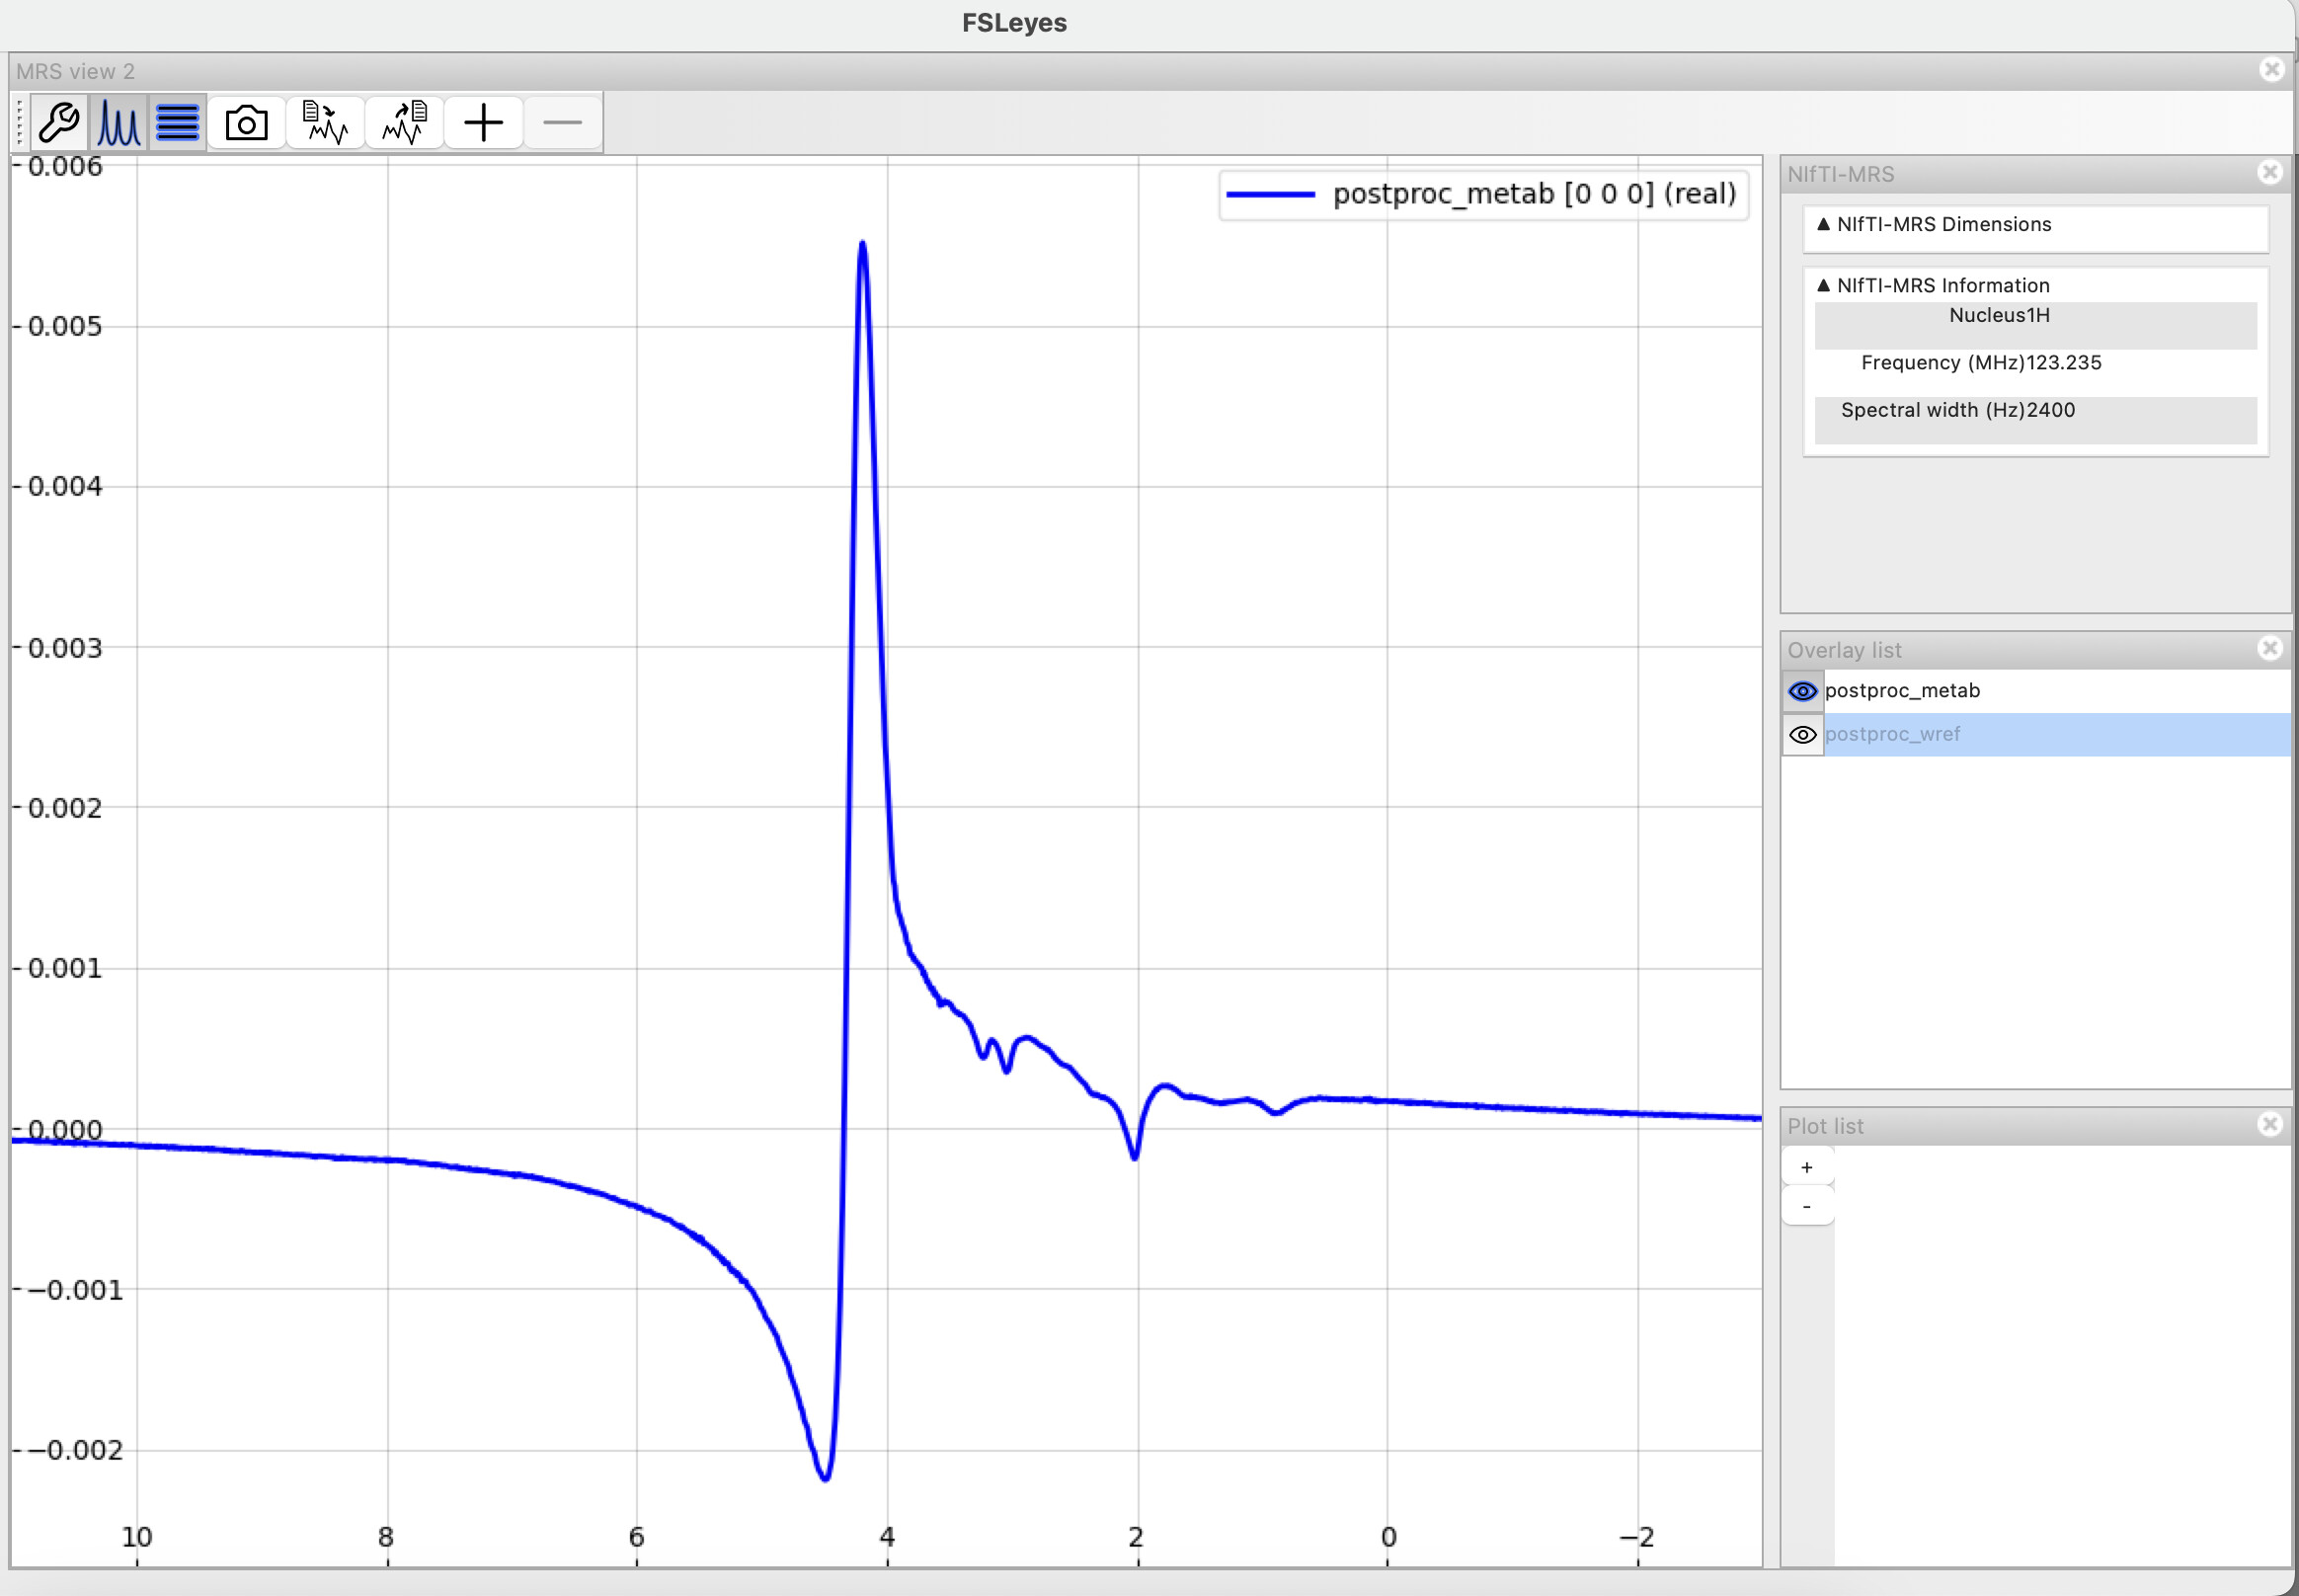
Here a two screenshots from FSLeyes of the metabolite spectra: pre and post-processed prior to fitting. Please let me know if you’d like me to clarify with additional images.
I assume you removed the 32 first points between these two plots? It definitely helped with the first-order phase error. There’s still a massive residual water peak that you might want to remove.
edit: if you have a water reference signal, apply eddy-current correction as well
In my set of commands I did not remove/truncate the first 32 points from my metabolite spectra. I did apply eddy-current correction though. Unsure why the residual water is still there.
Would it be possible to suggest what may be going wrong? I’ve attached the commands I ran, they are as per the instructions given in the fsl_mrs tutorial by @wclarke mergedReports_ExampleSub.pdf (2.2 MB) PRESS_commands.txt (2.4 KB)
truncate (truncation or zero padding)
Takes either a single file or list of files (--file ) and adds or removes points (--points , positive to add, negative to remove) from the start or end (--pos , default end) of the FID. Points added are zeros.
So probably something like truncate --points -32 --pos start? This would need to be done right after loading the data.
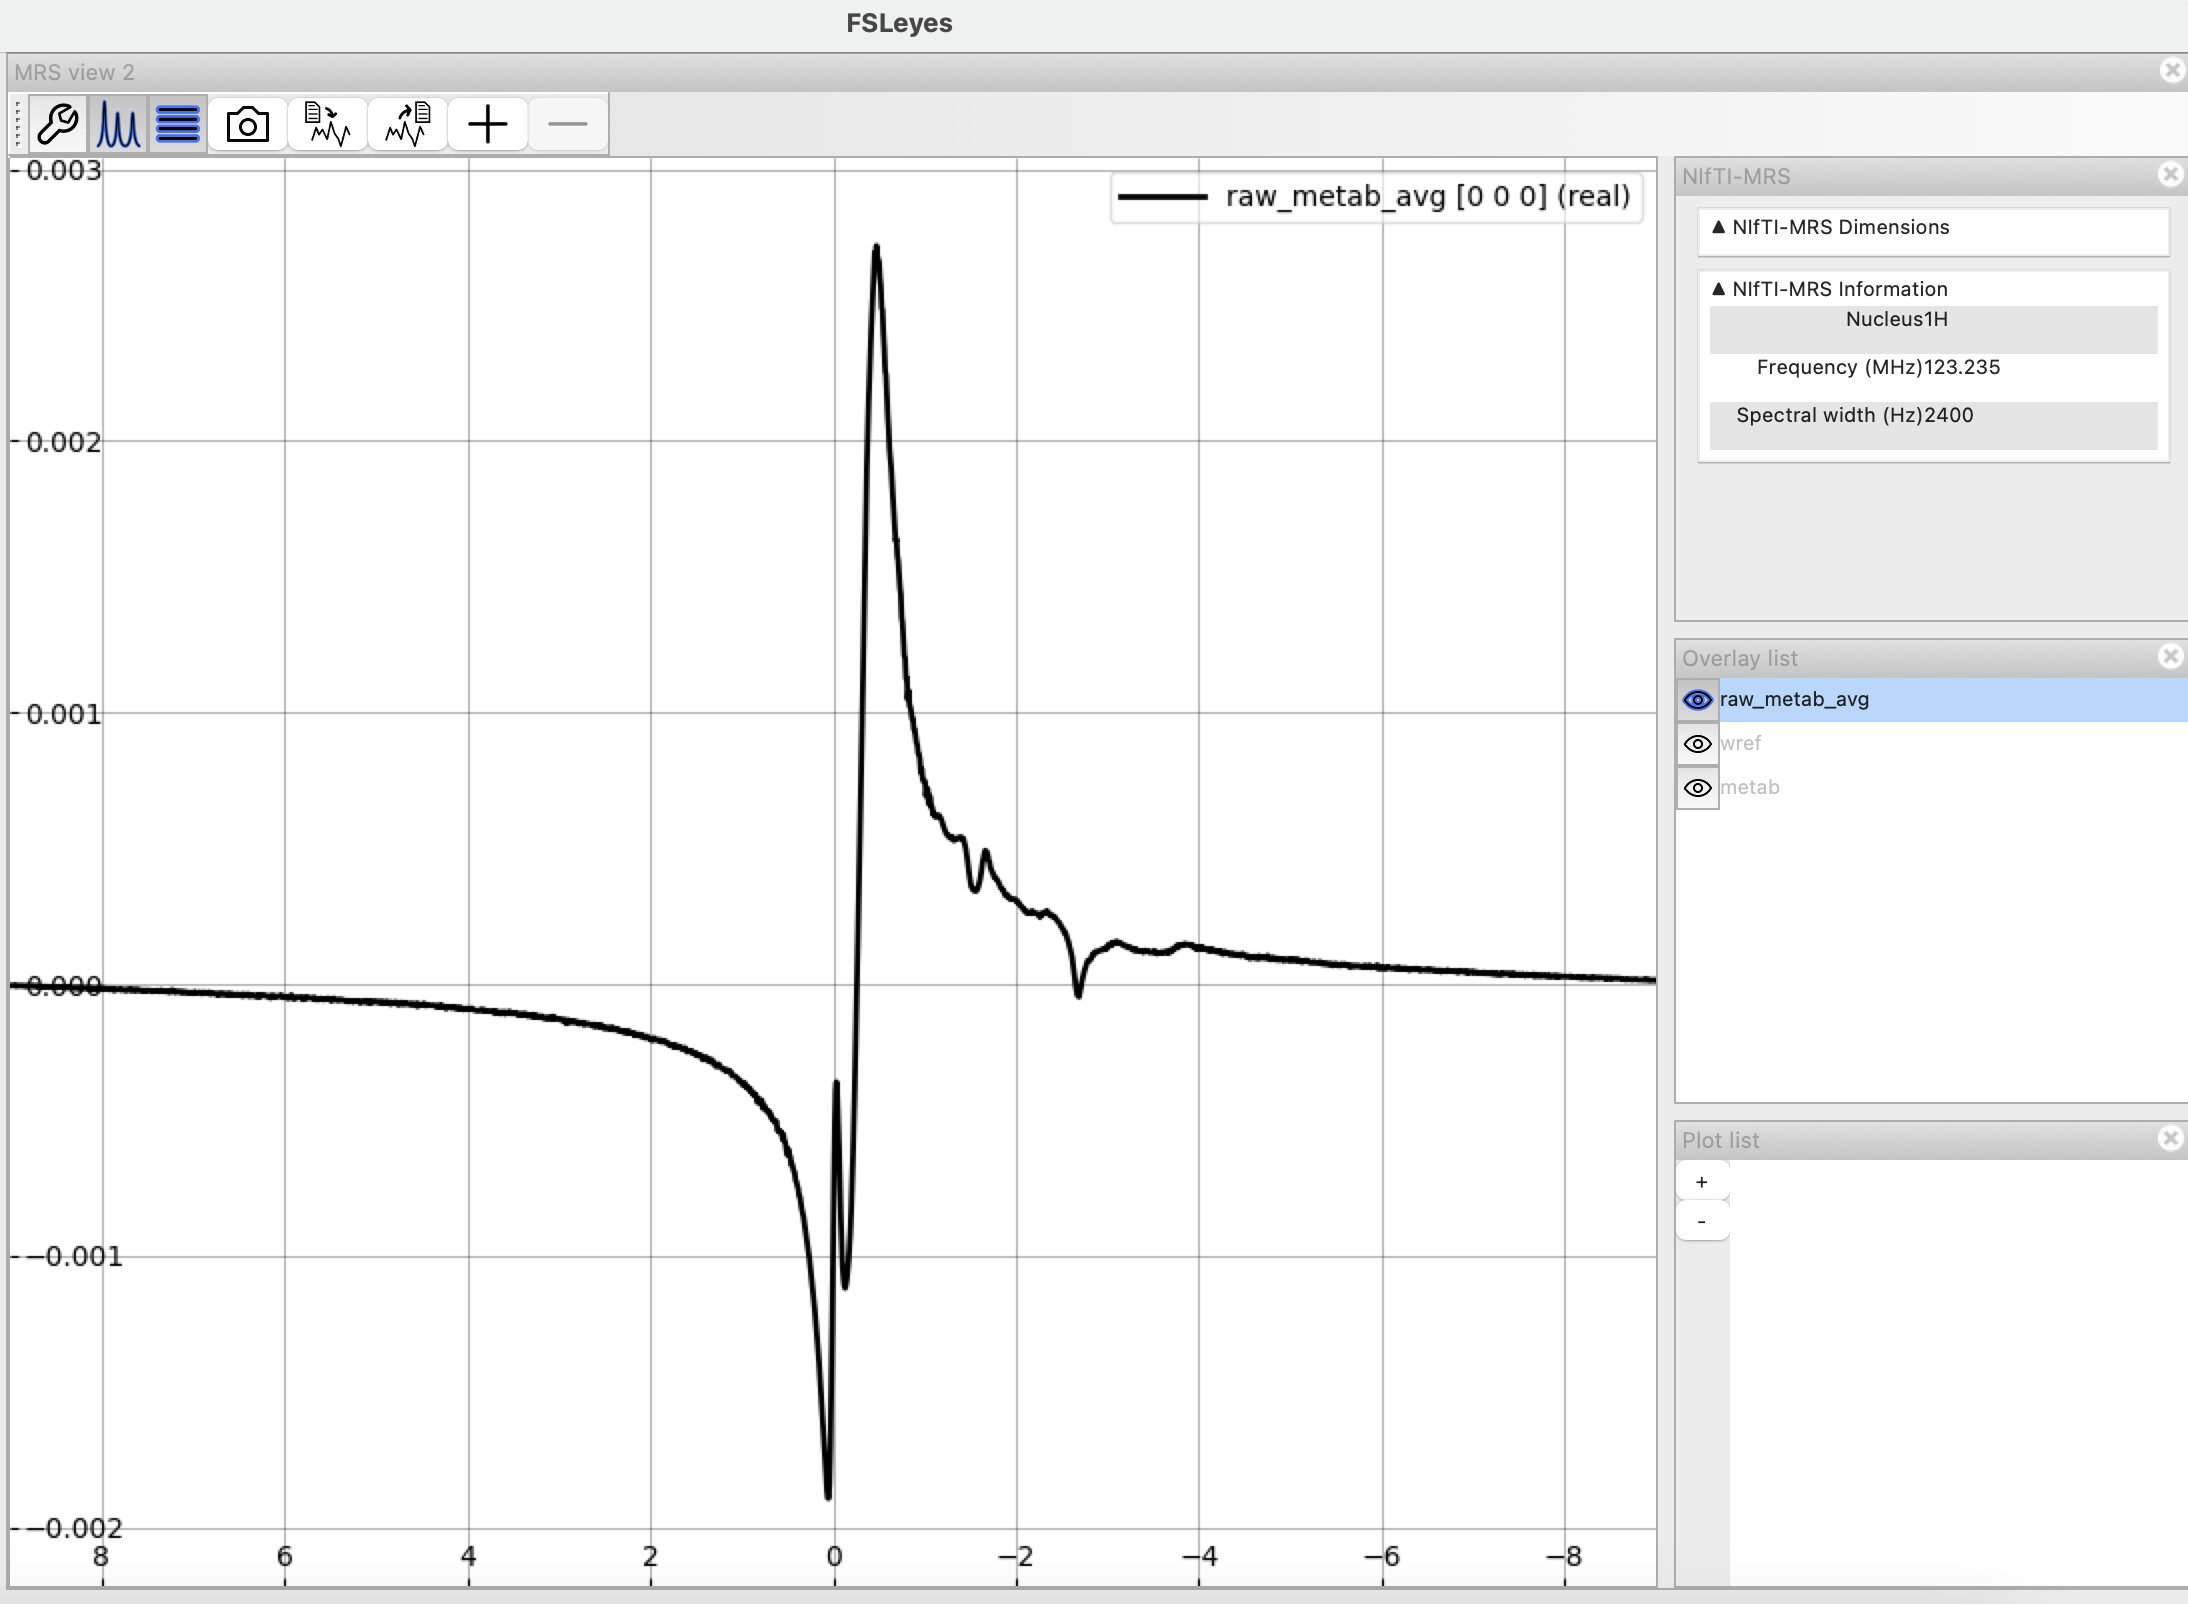
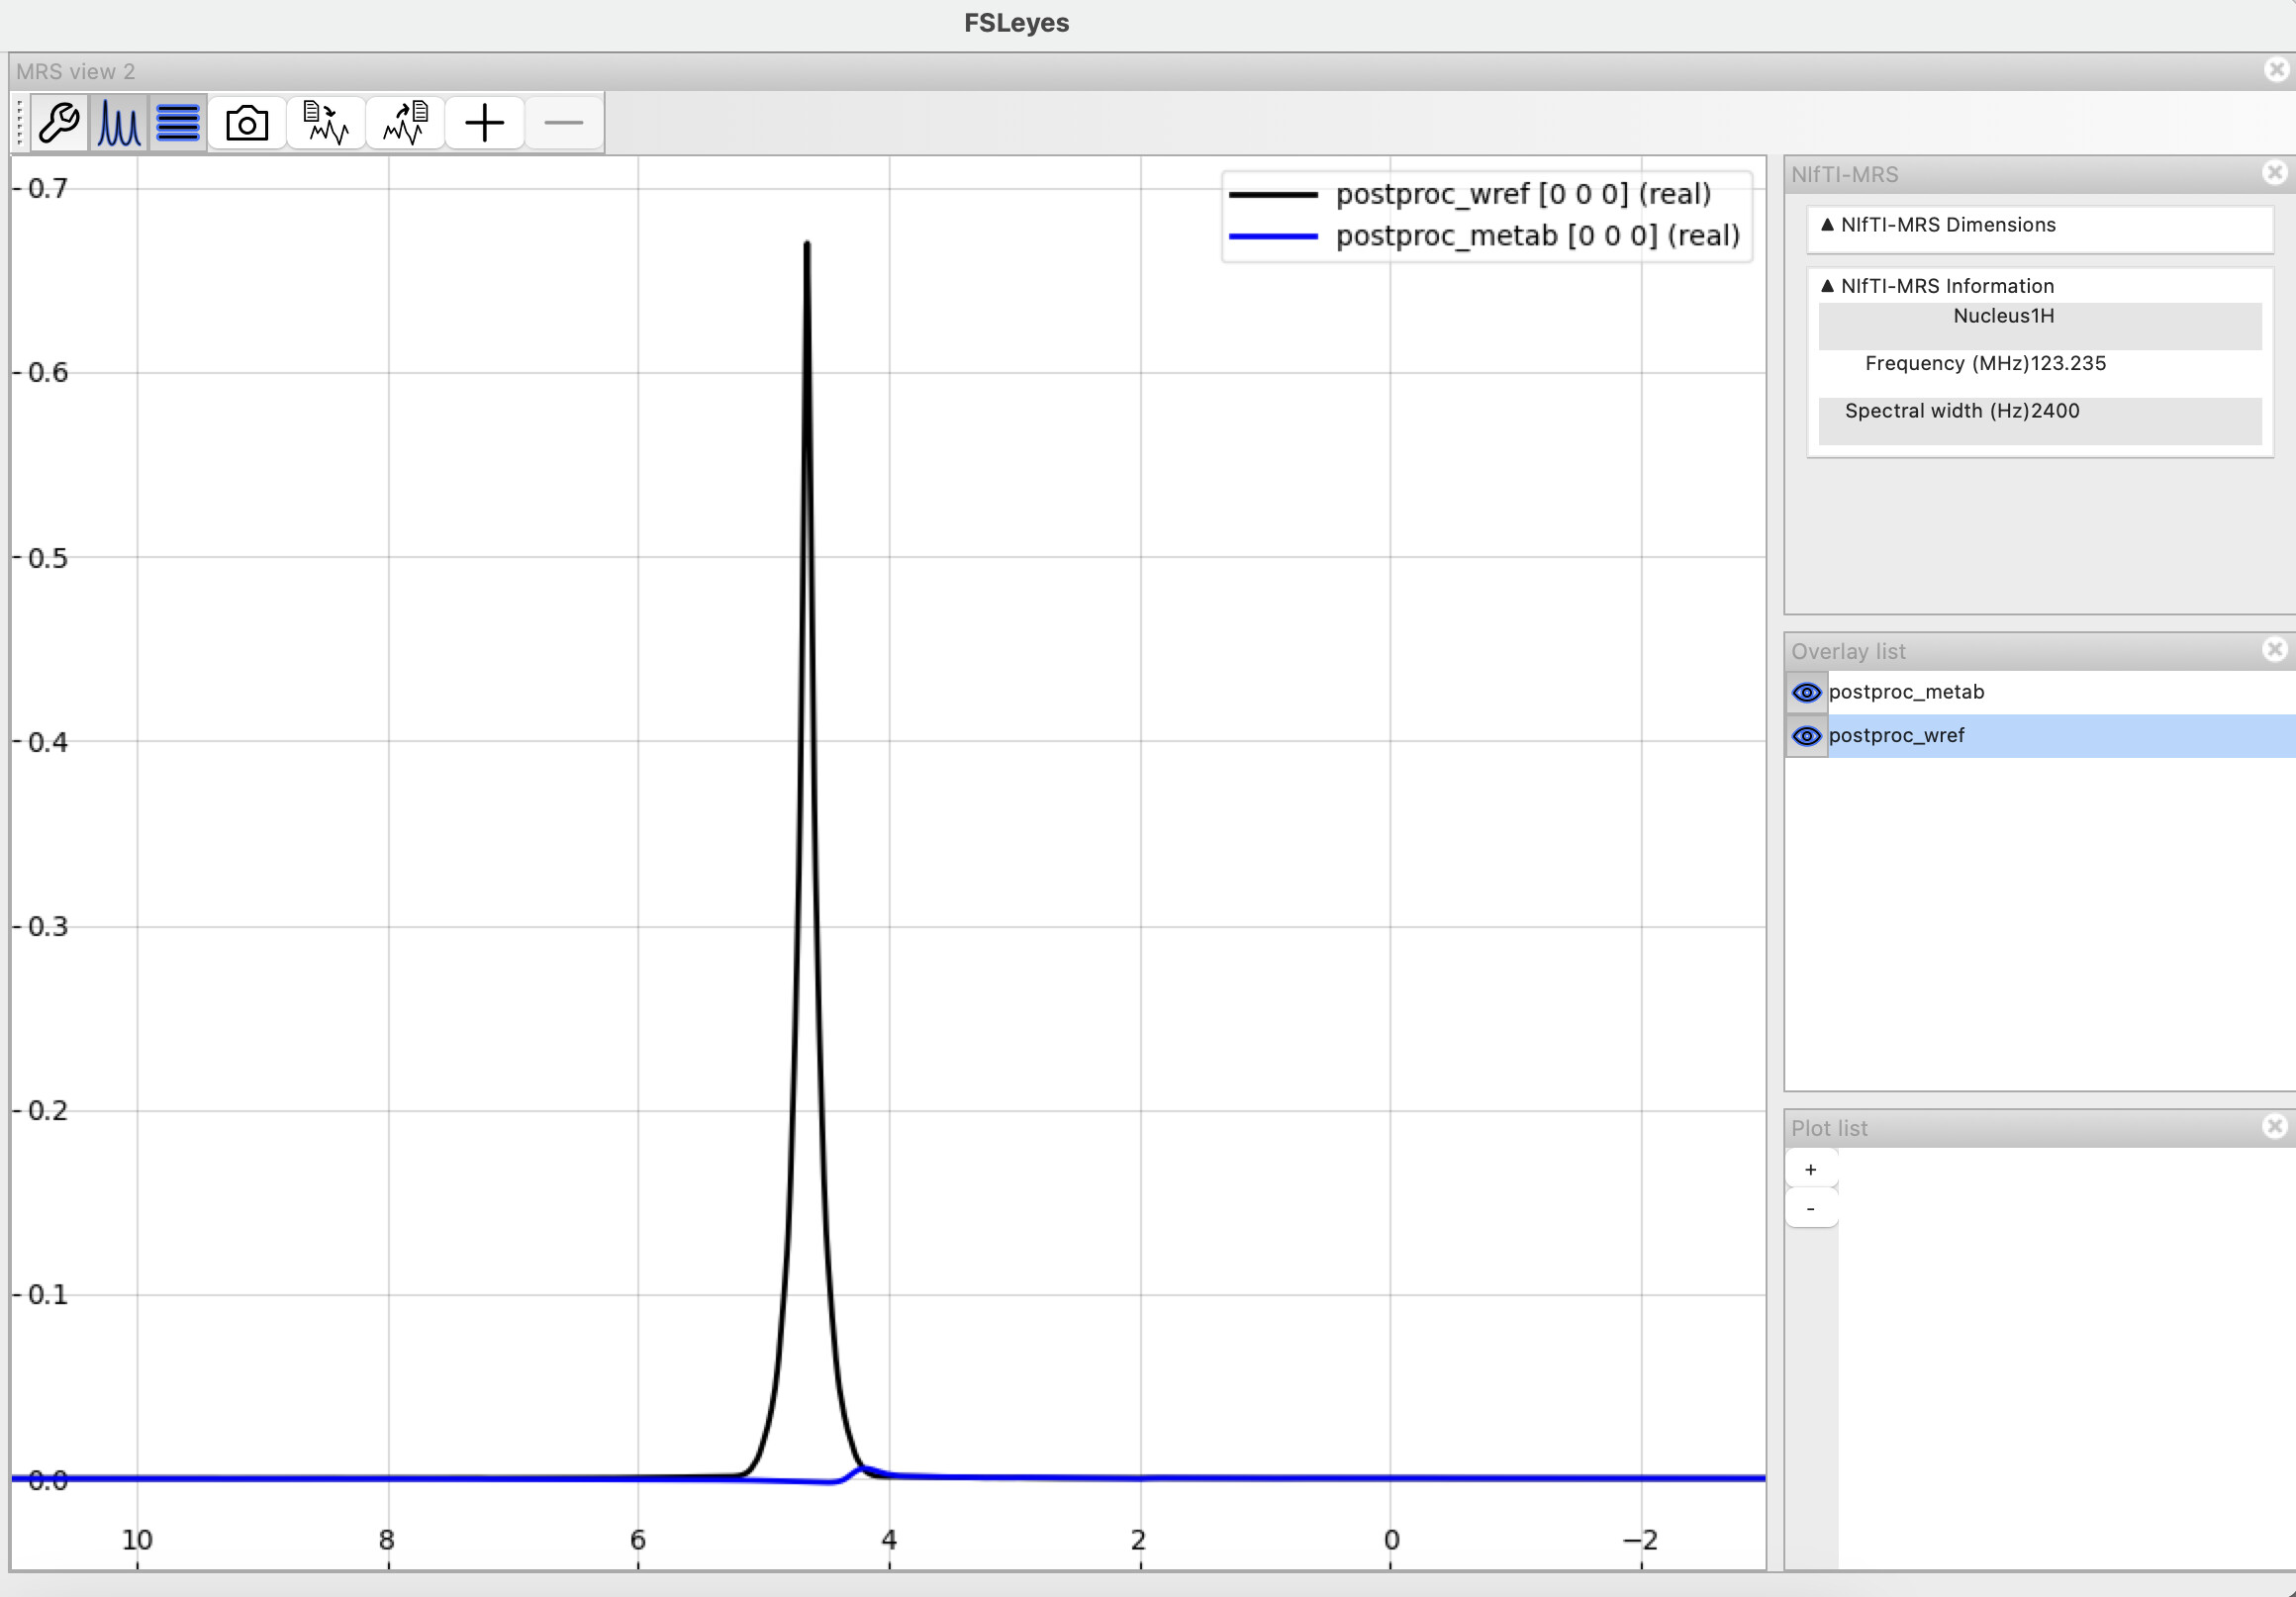
Here is how my metabolite spectra look (after including the truncation step). Can I try fitting with a BASIS or does this still look off? (Apologies - I’m new to this modality and don’t have the best idea of how to judge the corrected spectra)
echo “1a. Removing zero padding - 32 points”
fsl_mrs_proc truncate --file raw_orig.nii.gz --points -32 --pos first --filename raw -r --output .
fsl_mrs_proc truncate --file raw_wref_orig.nii.gz --points -32 --pos first --filename raw_wref -r --output .
File raw.nii.gz
NIfTI-MRS version 0.9
Data shape (1, 1, 1, 2048, 32, 128)
Dimension tags: [‘DIM_COIL’, ‘DIM_DYN’, None]
Spectrometer Frequency: 123.235471 MHz
Dwelltime (Spectral bandwidth): 4.167E-04 s (2400 Hz)
Nucleus: 1H
Field Strength: 2.89 T
File raw_wref.nii.gz
NIfTI-MRS version 0.9
Data shape (1, 1, 1, 2048, 32, 16)
Dimension tags: [‘DIM_COIL’, ‘DIM_DYN’, None]
Spectrometer Frequency: 123.235471 MHz
Dwelltime (Spectral bandwidth): 4.167E-04 s (2400 Hz)
Nucleus: 1H
Field Strength: 2.89 T
@admin , thanks for the help in answering these questions.
@S_G , as @admin said, there’s still a significant amount of residual water here and it looks like the shim isn’t great. Is this a representative example from a larger dataset, or a first attempt at performing an acquisition? If the latter, then it might be quicker for us to advise on how to improve the acquisition rather than fiddling with post-processing steps.
Thank you very much @wclarke and @admin for helping me out!
@wclarke yes, this is a representative example from a larger dataset.
Regarding the earlier doubt: 4# are you sure your dataset does actually have 2080 data points, i.e., can you please share the exam card that was used to generate this data?:
The MRI tech coordinating the acquisition could not share the exam card, but instructed me to run these commands to check where the padding was:
twix_obj = mapVBVD('spectro_data.dat');
preCutOff = twix_obj.image.cutOff(1,1); % extra points before echo
postCutOff = twix_obj.image.cutOff(2,1); % extra points at the end
Software version: VD (!?)
Reader version: 1660732089 (UTC: 17-Aug-2022 10:28:09)
Scan 1/2, read all mdhs:
    33.2 MB read in    0 s
Scan 2/2, read all mdhs:
    65.9 MB read in    0 s
File Type: water_suppressed
Pre CutOff: 4
Post CutOff: 28
—————————————
Software version: VD (!?)
Reader version: 1660732089 (UTC: 17-Aug-2022 10:28:09)
Scan 1/2, read all mdhs:
    33.2 MB read in    0 s
Scan 2/2, read all mdhs:
     8.9 MB read in    0 s
File Type: water_nonsuppressed
Pre CutOff: 4
Post CutOff: 28
—————————————
It looked like there were 4 and 28 points of padding pre/post echo, so I truncated the data accordingly and reran up to fitting.
I’m still not sure why there is so much of residual water, if you have any ideas on the best way to proceed/troubleshoot, I would greatly appreciate it. Thank you very much for your help thus far!