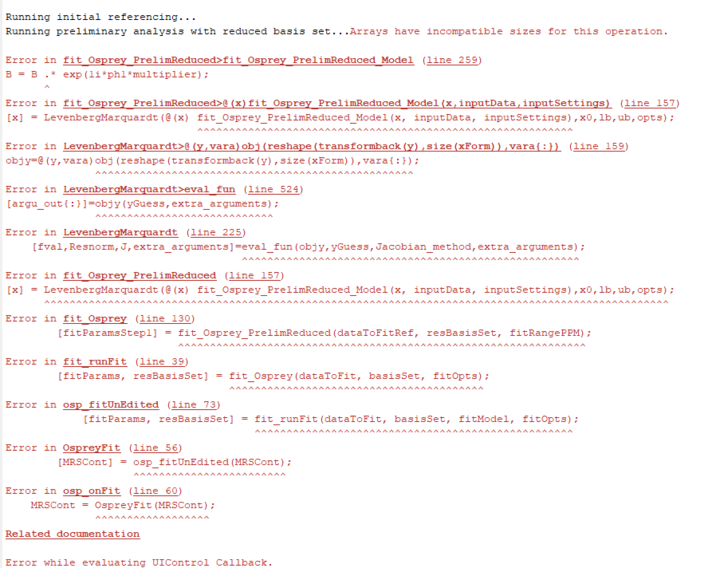
Hello all! I am very new to MRS processing and wanted to ask about processing Siemens XA30 and XA50 data using the LCModel in Osprey. When using the GUI, I am able to select load data and process data with no errors. However, after selecting process data, there is no data shown in the top right graph for chemical shift drift. Based on this post (https://forum.mrshub.org/t/lcmodel-table-error/2031) I would assume that means that the LCModel wasn’t able to complete the fit. Further, when I try to model the data, I get the error shown below.
I just wanted to reach out to see if anyone knows how to address the error is Osprey or what the best approach is for the Siemens RDA files. I have tried to use Suspect code in Python in the past to process the data, but unfortunately the text headers in my files are different from the one the code references so I wasn’t able to use it. After reading around, it seems that other people have had issues with RDA files here and there so I was wondering if anyone has advice on how to proceed. For reference I have Siemens XA30 and XA50 single voxel MRS data acquired on a 3T scanner with TE = 30 and TR = 1500 and I am using Osprey v2.9.2 with default settings. Thank you!
Can you post the output for the loaded and processed data as well as the job file you’re using? This is a very odd error because it appears to be related to the baseline model, but that should work flawlessly on default settings.
Also, this error message suggests that the data are modeled with the internal Osprey algorithm, not LCModel (check the LCModel example job file for how to set up the LCModel interfacing).
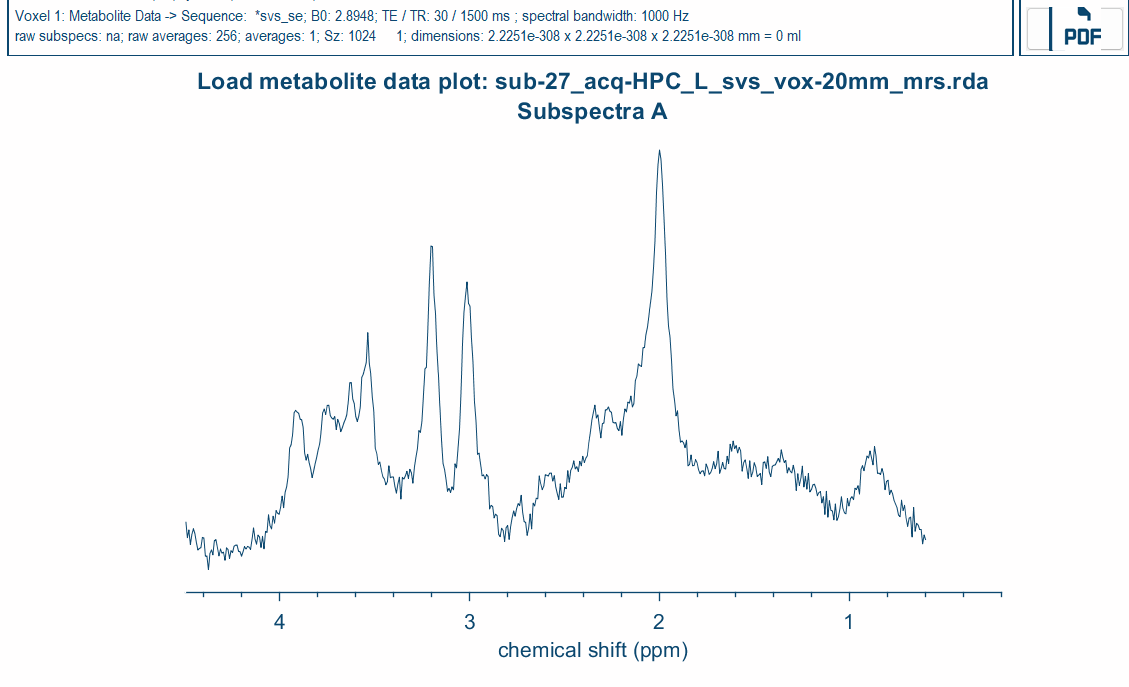
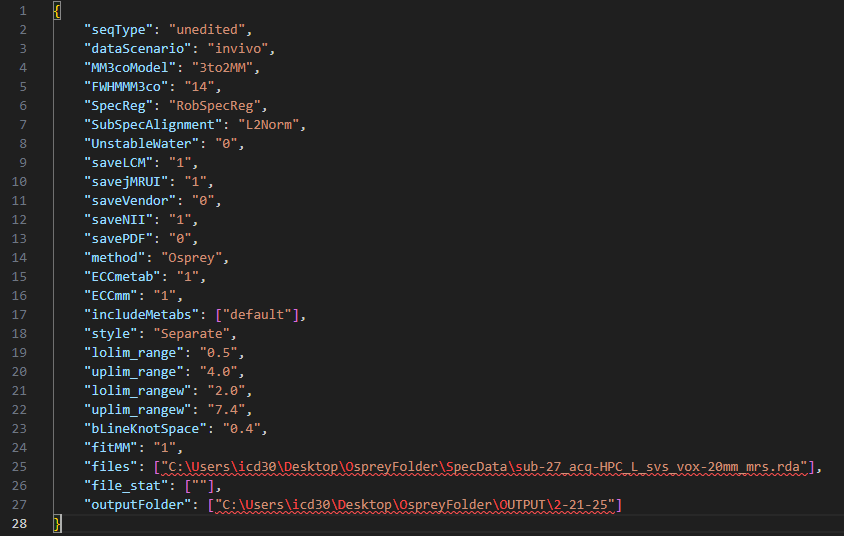
Hello! I have attached screenshots of the output for the loaded and processed data, as well as the job file. I am currently troubleshooting the error with a single subject before trying to run analyses on all of the collected data.
Also, my mistake. I am using the internal Osprey algorithm, not LCModel. I appreciate the clarification!
Your spectral width is pretty narrow = 1000 Hz means that you only get 500 Hz either side of water, i.e. slightly more than 4 ppm, which is why there is no data below ~0.6 ppm. But the default Osprey fit range is 0.5-4 ppm. We should probably create an error message to intercept cases like this, but virtually every dataset we’ve ever encountered being used has a larger spectral width. I usually recommend something like 2048 pts @ 2 kHz or 1024 pts @ 1.2 kHz.
To get this dataset analyzed, try setting the lower value for the fit range to like 0.7, but there might still be some hiccup - Osprey usually assumes some range extending to below 0 ppm to carry out noise calculations.
Thank you so much! Given our narrow spectral width, which metabolites may this interfere with analyzing?
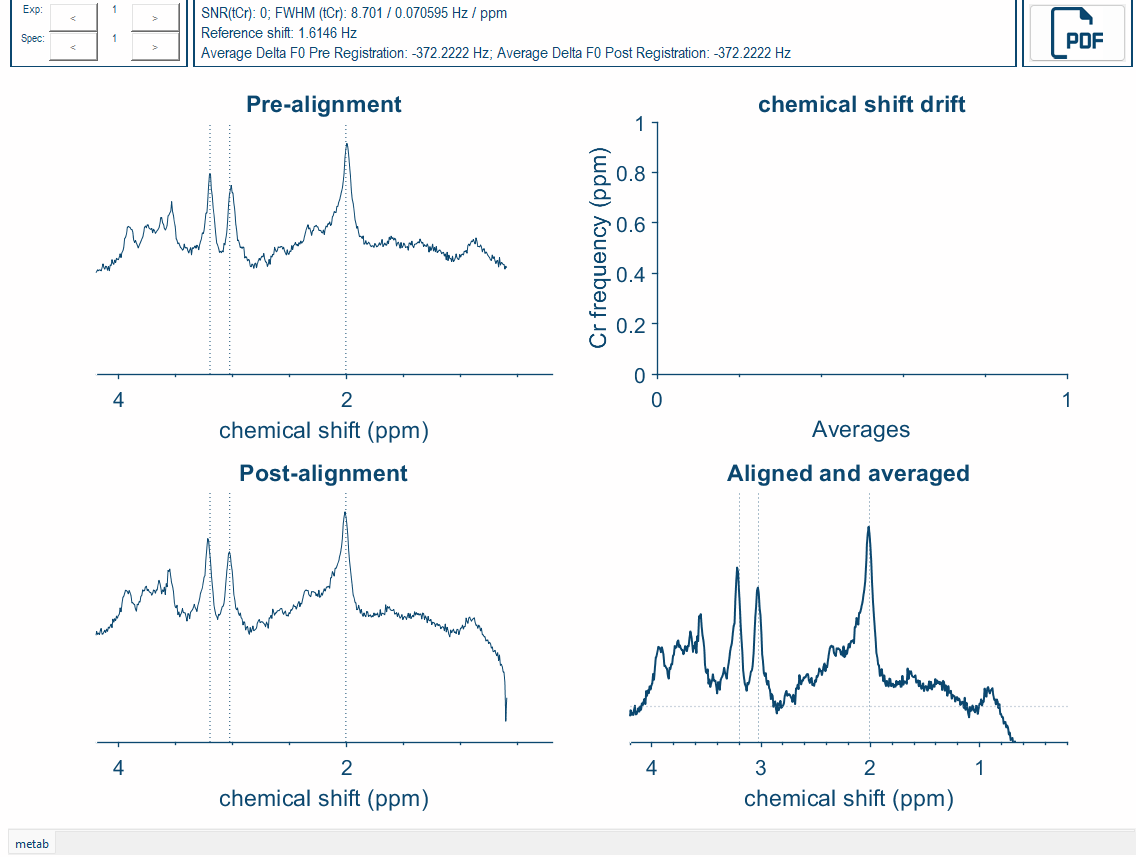
I have now set the Osprey fit range to 0.7-4 ppm. I was able to select “model data” and get an output with the fit completing. However, the graph for chemical shift drift is still blank.
Additionally, when checking the MRS Summary text, the SNR value is at 0 and it seems the data is being misread as having a voxel size of 2.22507e-308 mm³. I have shared the summary below. Do you know what might be causing this, and if I should make any adjustments on my end?
My guess is that the RDA data are pre-averaged on the scanner and only contain the average spectrum. There should be an exam card setting that says ‘Save uncombined’, which should store separate RDA files for each transient.
Yeah, SNR = 0 makes sense - I think that Osprey looks to estimate noise beyond 0 ppm, but doesn’t find any data points (or signal) in that range and therefore can’t estimate their SD. We’d need to fine-tune the range where it looks for signal, but honestly, in a frequency range this narrow that’s quite unlikely to be possible (there are small upfield signals on the other side of water too).
The header fields in XA30 RDA files that carry the voxel orientation and size have changed compared to previous headers, so my guess is that it now just finds the voxel dimensions to be zero. Can you try and convert your RDA files to the ‘old’ format with the scripts described here and here?
EDIT: If you have the raw TWIX data (.dat), you’ll get the frequency traces and (in all likelihood) the correct voxel dimensions etc.